
SE Ranking updates: September 2019
Time sure does fly. Kids have only been back to school for like five minutes, and it’s October already! Over at SE Ranking, we ourselves have had a very productive month and are happy to share our September updates with you.
Here’s a quick overview:
- Analytics & Traffic got a complete makeover
- New SEO/PPC Competitor Research feature — now you can add your own keywords to our database
- Report Builder and Rankings improvements
- Localized the website for Spanish-speaking countries + launched the Spanish blog
- Fully translated the platform into Portuguese.
Now, let’s discuss each update in closer detail.
Huge Analytics & Traffic upgrade
We’ve considered your feedback and suggestions on improving the Analytics & Traffic module, and decided to make some big changes that, ultimately, had an impact on two main tabs: Overview and Traffic.
Overview
We’ve added additional graphs to the Overview tab to provide more detailed information about your audience, their activity throughout your website, traffic sources, as well as data on search visibility, keyword importance and changes, and rankings overview.
This data is pulled from Google Analytics, Google Search Console, and our own databases. You can simultaneously integrate all of these services and compare different results for your project.
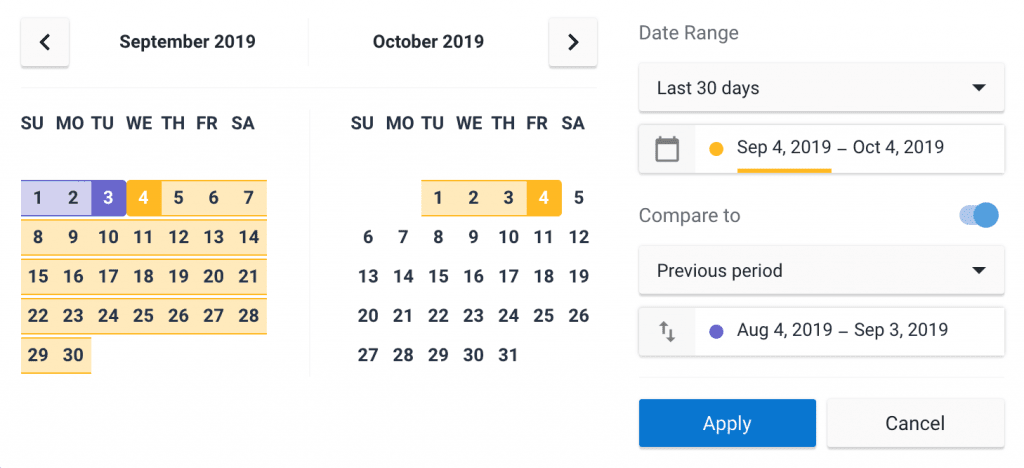
First off, now you can choose any date range you want to check! It can be a specific day or a time period. We’ve also made it possible to compare data from two different time periods that are represented by two different colors on the graphs.
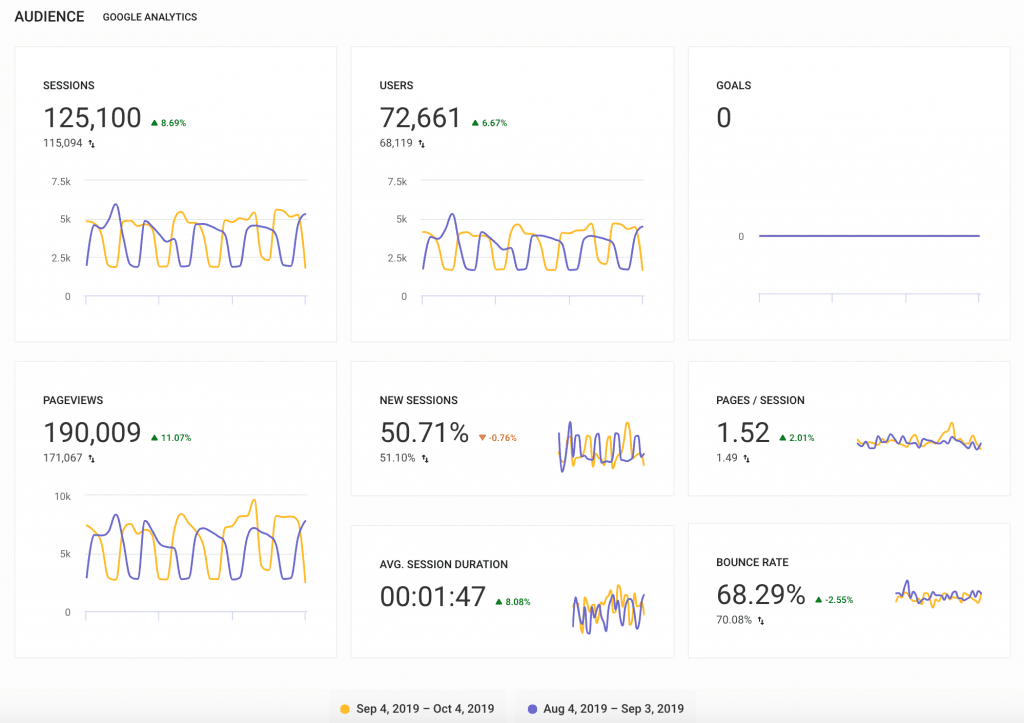
The first section you see under this tab shows you detailed information about your audience. How many people came to your website within the set date range? How many sessions and pageviews were recorded? And more profound information like the total number of new sessions, the average session length, and the average number of pages viewed during a session.
Additionally, you can set goals in your Google Analytics account here and see how many have been accomplished as well. The last graph shows the percentage of single-page sessions that didn’t result in any interaction with the page. Remember that you can easily see data changes in all these graphs by comparing two time periods.
The next new graph contains Location Data that indicates where your sessions started. This information is expressed in percentage for every country, even if the number is very small. If you choose to run a comparison, you will see two maps. All in all, the data shown here is more accurate and informative.
The Traffic Sources section shows you how much traffic comes from organic, paid and direct search, referral links, and social media. Plus, you can compare results with any previous time period.
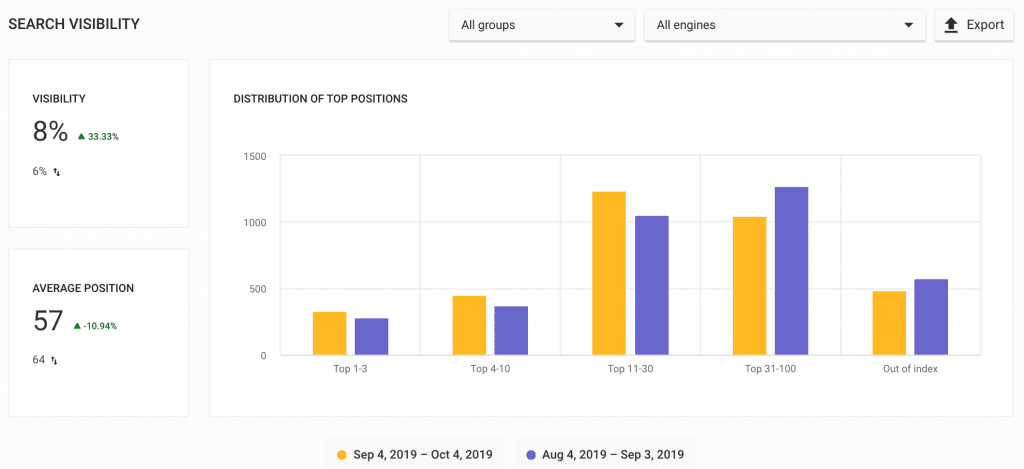
Up next we have Search Visibility. This section shows the percentage of people who will see your site upon entering the target search query, along with the average ranking position and number of keywords in the Top 3/10/30/100. You can choose to get data for a specific search engine or keyword group, or get an overview of all keyword groups and search engines.
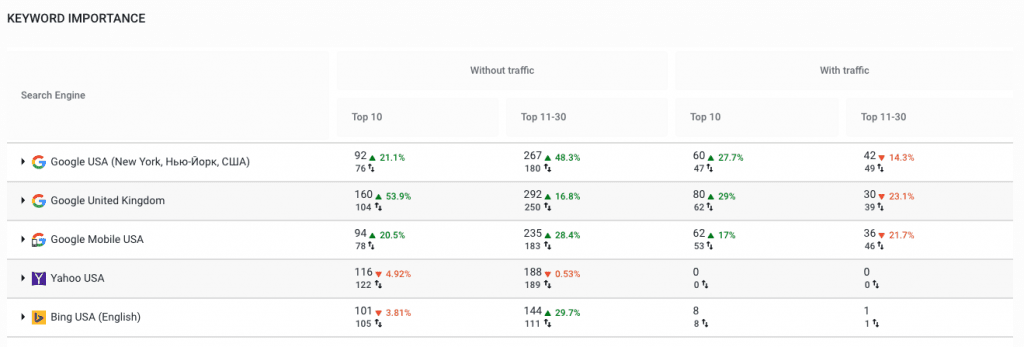
As you scroll further down the page, you will see tables with data from our service, such as keyword importance, rankings overview and keyword changes in the selected search engines.
Keyword importance is useful for keyword prioritization as it analyzes which ones get more traffic.
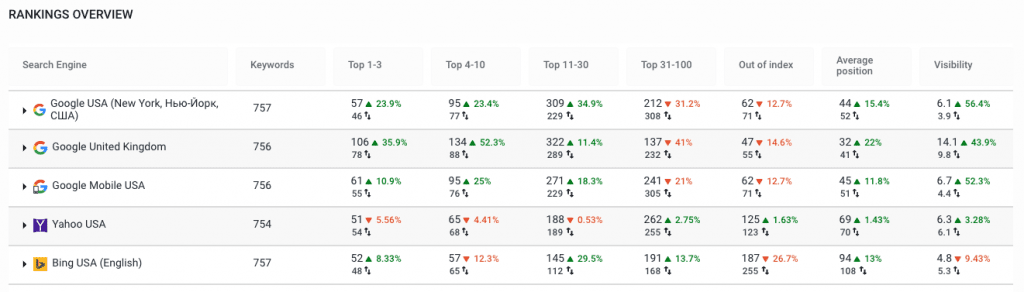
Rankings overview lets you get a bird’s eye view of your website rankings. Here you can see how your site’s rankings have changed for the top ranking spots, rankings that are out of index, average rankings, and search visibility for every tracked search engine.
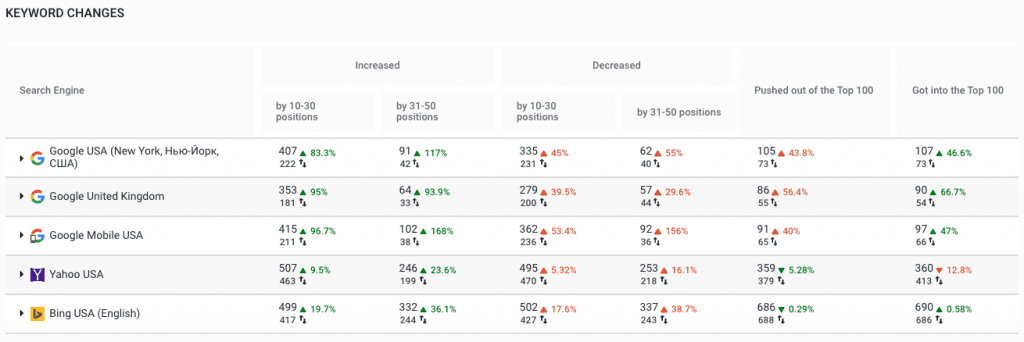
Keyword changes show how many keyword ranking positions have jumped, dropped, dropped out of or entered the Top 100.
Traffic
For more detailed information about your audience, go to the also redesigned Traffic section. Now there are four new tabs in it: traffic sources, audience, pages, and conversions. Let’s take a closer look at each one of them.
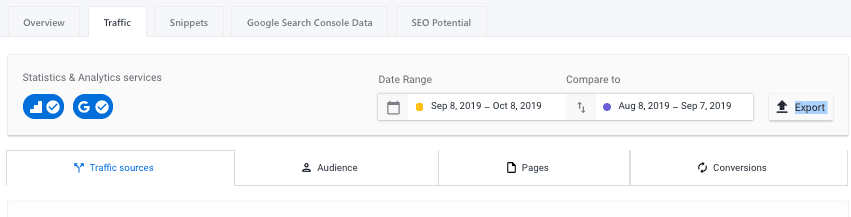
Under the Traffic sources tab, you can see not only the overall number of visitors that came from organic search, paid search or other sources, but also their exact origin and data on how they interact with your website. For example, here’s a graph that shows sources of organic traffic.
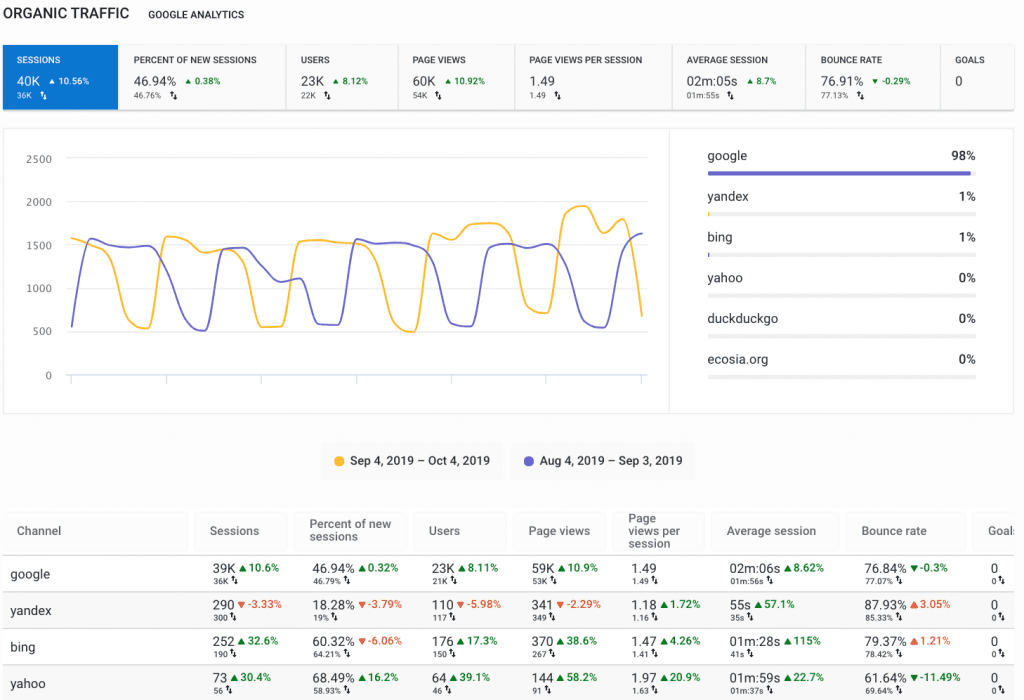
With this data, you’ll be able to understand the main sources of traffic and track their activity.
Next, the Audience tab. Here you can find out from which countries people come to your website, their age, gender and what devices they use. This will help you create a digital profile that you can use to set up targeted advertising campaigns.
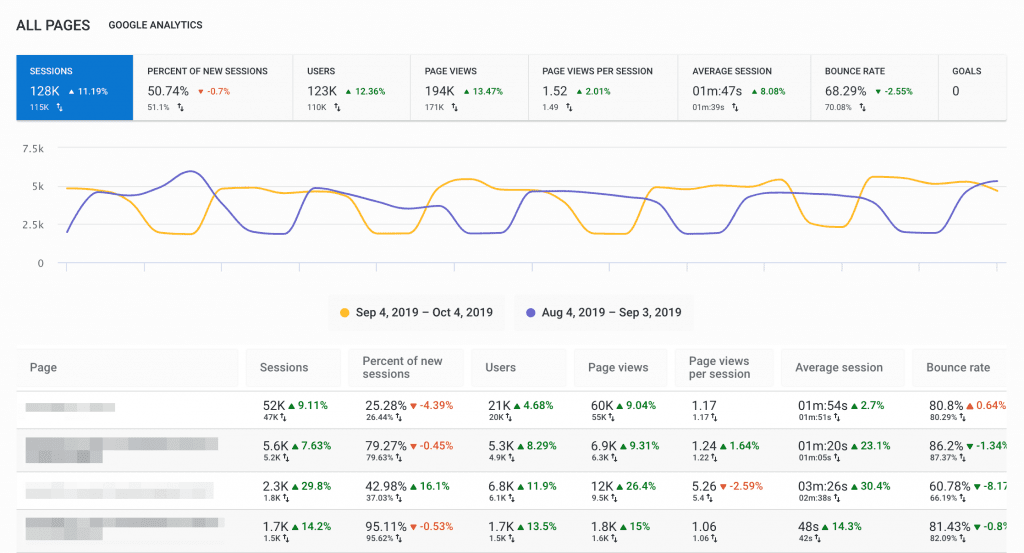
Now, let’s move on to the Pages tab. This is where you can find out which pages of your website got the most number of views, clicks and bounces. The three graphs available here provide info on all pages, landing pages and exit pages.
Last but not least, we have the Conversions tab. Here you can view data on useful actions that were performed online and offline. For example, you can set conversion goals like newsletter subscription or completed purchase.


Expand our databases with your own keywords
You can now find a new option called ‘Expand database’ in our SEO/PPC Competitor Research tool that we are constantly updating based on user feedback. This feature allows you to upload your own list of keywords to any of our country databases and get a detailed SERP analysis on each one, organic and paid results included.
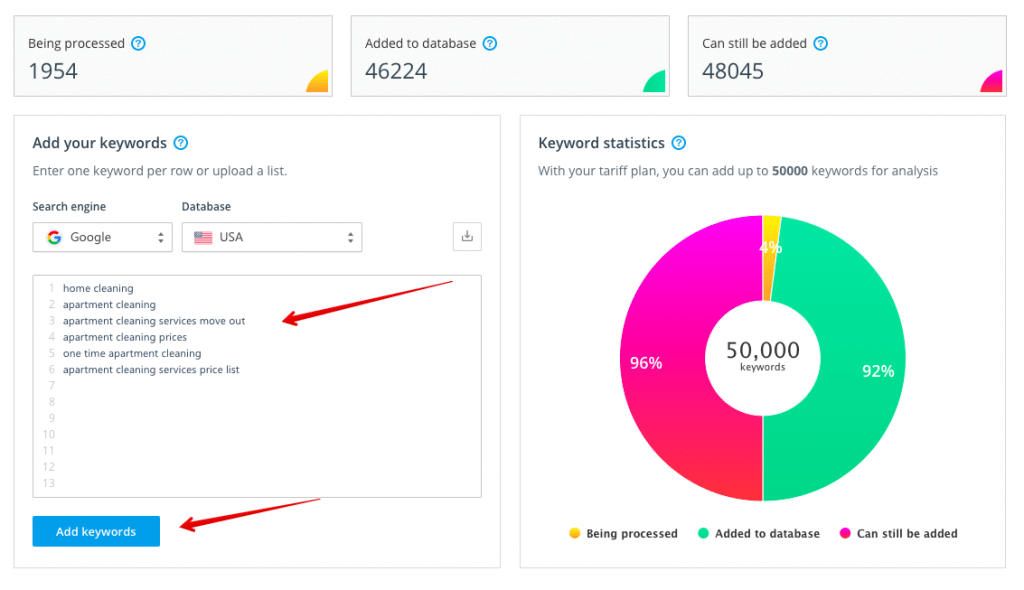
Learn everything about the new feature and its benefits here.
Report Builder improvements
We’ve updated the Project Summary report section to make it more informative. You can choose a project and search engine you want to get information on (one or all), and then add the necessary graphs and charts: average position, % in Top 10, search visibility, top 5 keywords that moved up, and top 5 keywords by ranking.
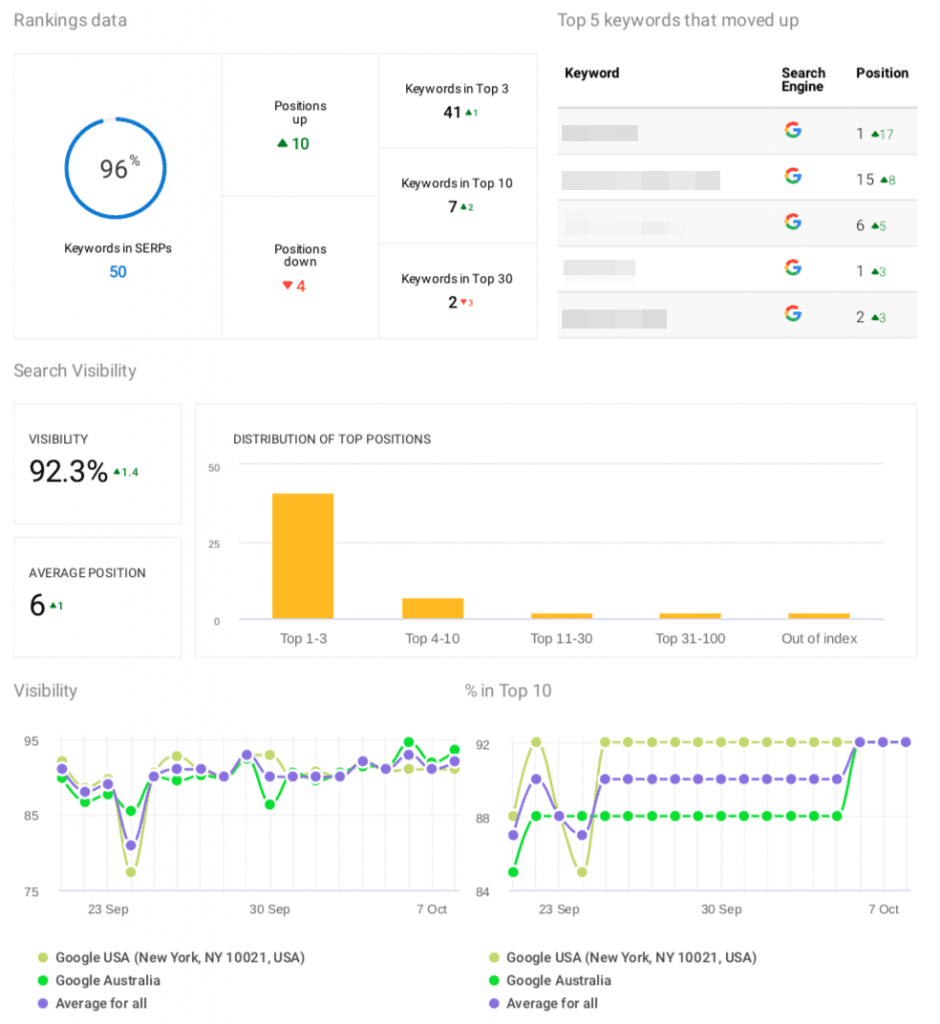
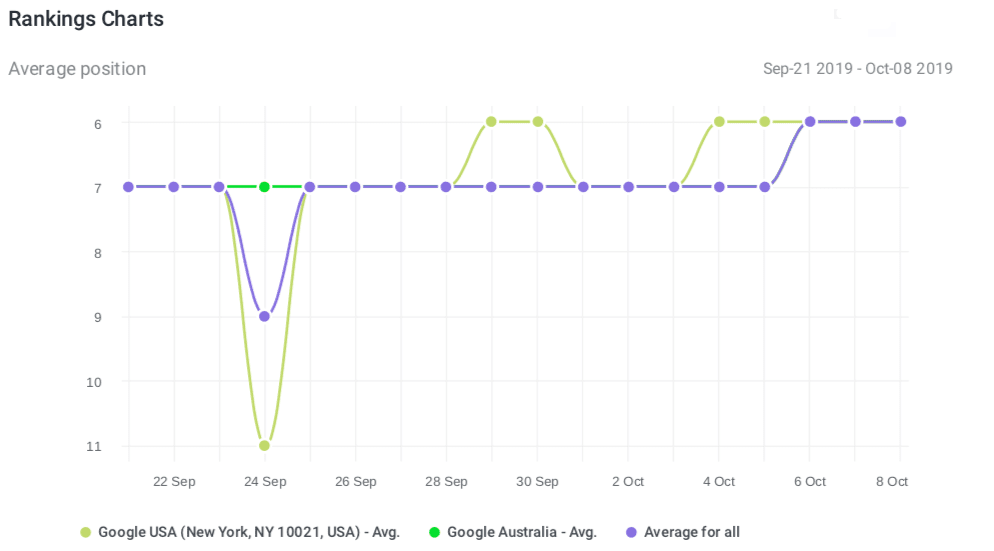
The Rankings Charts now let you choose the search engine and location you want to get data on. We used to demonstrate average ranking position for all locations, but now you can also choose one or several depending on your needs, or even make a comparison.
Moreover, we’ve created separate lists of pre-made templates and custom ones to make easier for you to find what you need and get started.
SE Ranking now speaks more languages
We are constantly working on making our product accessible to everyone, that’s why we have created a multilingual website. And we are happy to announce that we’ve now added Spanish to the list! All the general information, features and tools, as well as the demo account are already available in español. Just change your language under account settings or at the bottom of any web page. Plus, we now also have a Spanish-speaking support team to answer all of your questions.
If Spanish is your native language or you have a colleague who speak it, spread the word and start using SE Ranking in a more comfortable and familiar environment. We also updated the German, Italian and Dutch versions of the platform, so be sure to check them out too if you’re interested.
Additionally, we’ve just cut the ribbon on the platform’s Portuguese version, so be sure to check it out if you’ve been waiting patiently.
As you can see, we had a highly productive September. And we’re not planning on slowing down ? Let us know what you think about the improvements. We are always very happy to get your feedback! And if you have any suggestions on what we should work on next, feel free to tell us.
Post Views:
730