
14 Metrics That Actually Predict Growth in 2026
Most ecommerce dashboards are beautifully useless. They surface dozens of numbers, highlight none of them, and leave you no closer to knowing what to fix on Monday morning. The problem isn’t a shortage of data. It’s a shortage of judgment about which ecommerce KPIs actually predict growth and which ones are just noise dressed up in a bar chart.
I’ve spent more than a decade as a Fractional CMO and have worked with multiple ecommerce brands of various sizes, from lean DTC launches to retailers doing eight figures. And here’s what I’ve learned: Less is more. The stores that do well stay focused on five to seven KPIs. The ones that have room for improvement are tracking forty and acting on none.
This is one of the problems I wrote Digital Threads to solve for small businesses and entrepreneurs. Speaking the language of Excel isn’t optional when you’re accountable for an ecommerce P&L. You need to know what you’re measuring, what “good” looks like, and what the number is telling you to do next.
So let’s cut through the noise. Below you’ll find the 14 ecommerce KPIs, in my opinion, that actually move the needle in 2026, what the current benchmarks are, how they interact, and how to pick the handful worth building your dashboard around.
Key Takeaways
✅ KPIs are the 5-7 numbers that predict growth, not the 40 your dashboard can display. The discipline is subtraction, not addition.
✅ The 2026 ecommerce conversion rate benchmark sits around 2.5% globally, with top performers hitting 4.7% or higher. Your number is only useful when segmented by device, traffic source, and customer type.
✅ Cart abandonment has hovered near 70% for over a decade. That’s a structural feature of online shopping, not a failure of your store.
✅ Retention is the most undervalued KPI in most ecommerce stacks. Small lifts compound into massive profit gains.
✅ LTV:CAC is the single ratio that tells you whether your growth is sustainable. Below 3:1 and the unit economics break.
✅ Your conversion rate means nothing without average order value. A 3% CR at $150 AOV beats a 4% CR at $75 AOV every time.
What Are Ecommerce KPIs?
Ecommerce KPIs are the specific, measurable numbers an online store uses to evaluate progress against its business goals. They quantify sales performance, marketing efficiency, customer behavior, and site health so operators can make data-driven decisions instead of guessing. Good KPIs tie directly to revenue, profit, or customer value and trigger a clear action when they move.
The word “key” does all the heavy lifting here. Every store has hundreds of metrics it could track. A KPI is one you’ve chosen because its movement signals something important about the business, something worth a meeting, a campaign adjustment, or a code change. If a metric drifts up or down and nobody changes what they’re doing, it isn’t a KPI. It’s a data point.
That filter alone will cut most dashboards in half.
How Are KPIs Different From Metrics?
A metric is any quantifiable data point your store can measure. The way I look at it, a KPI is a metric that should directly map to a business goal and drives decisions. Every KPI is a metric, but most metrics will never become KPIs. The distinction matters because tracking too many metrics creates noise, while tracking the wrong KPIs produces false confidence.
Here’s the test I give clients. For every metric on your dashboard, finish this sentence: “If this number goes down by 10%, we will do X.” If you can’t fill in X with a concrete action, that metric isn’t earning its spot.
Think of it like a car dashboard. Your speed, fuel level, and engine temperature are KPIs because each one triggers a specific response. The color of your seats is a metric. Both are real data. Only one tells you whether to keep driving.
Which Sales and Revenue KPIs Should You Track First?
The four sales and revenue KPIs worth tracking are conversion rate, average order value, revenue per visitor, and gross margin. Together they answer the four most important questions about your business: How often do visitors buy? How much do they spend? What’s each visit actually worth? And what’s left after the cost of the product?
Conversion Rate
Your ecommerce conversion rate is the percentage of site visits that result in an order. The formula is orders divided by sessions, multiplied by 100. According to Blend Commerce’s 2026 Shopify benchmarks, the global average reached 2.5% in Q3 2025, up 0.4 percentage points year over year, with top performers hitting 3.2% or higher.
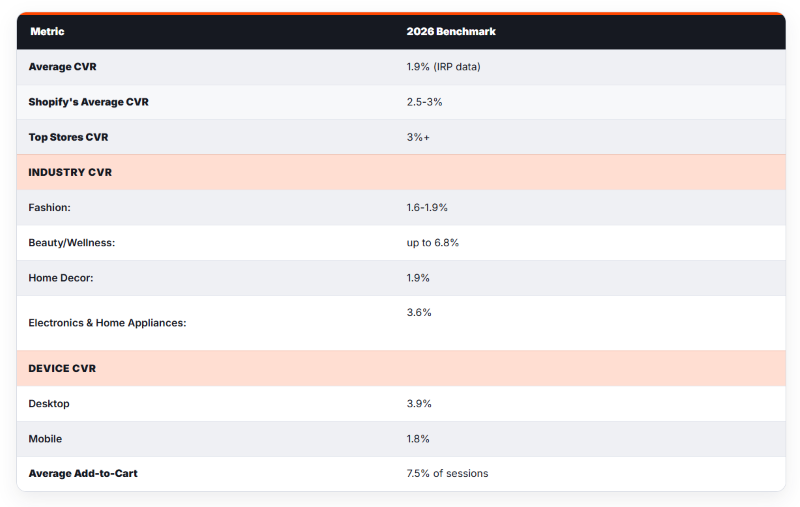
But that blended number is almost useless in isolation. Shopify’s own guidance is that a “good” rate depends on industry, price point, device mix, and traffic source. A 2% conversion rate for a $400 watch store is outstanding. A 2% conversion rate for a $45 beauty brand is a problem.
The segments that matter most when you benchmark, per Convertibles’ 2026 conversion rate analysis:
Is Your LinkedIn Not Delivering Results?
Just released: my new book to help professionals, entrepreneurs, and business owners maximize LinkedIn for real growth.
With years of LinkedIn expertise, Maximizing LinkedIn for Business Growth offers actionable steps to build your brand, expand your network, and drive results.
Start leveraging LinkedIn like never before—grab your copy now! Click the cover or button below to buy on Amazon.

- Device. Desktop typically converts at 3.5-4% while mobile lags at 1.8-2.5%.
- Traffic source. Email converts at 4-5.3% while paid social converts at just 0.7-1.2%.
- Customer type. Returning customers convert at 4.5-6%, first-time visitors at just 1-2%.
I’ve written a dedicated guide on good ecommerce conversion rate benchmarks that breaks these segments down further.
Average Order Value (AOV)
AOV is total revenue divided by number of orders over the same period. It answers a question that conversion rate alone can’t: when a customer does buy, how much are they spending? AOV is one of the three levers inside customer lifetime value, so every dollar you add here compounds across every future purchase.
Here’s the thing about AOV that most miss. Raising it by 15% through better cross-sells, thoughtful bundles, or a smarter free-shipping threshold is almost always easier than raising your conversion rate by 15%. You already have the buyer on the page. You just need to give them a reason to add one more item.
Revenue Per Visitor (RPV)
RPV is total revenue divided by total sessions. It bakes conversion rate and AOV into a single number and is, in my opinion, the most underrated ecommerce KPI out there. If your conversion rate drops 10% but AOV rises 20%, RPV is up and your business is healthier. Looking at conversion rate alone would have lit up a false alarm.
Gross Margin
Gross margin is the percentage of revenue left after the cost of goods sold. The formula is (revenue minus COGS) divided by revenue, times 100. This is where a lot of brands quietly lose the plot. They celebrate revenue growth while gross margin erodes from rising product costs, discounting, and return rates. If your margin falls faster than your revenue grows, you’re running a volume trap.
Which Customer KPIs Predict Long-Term Profitability?
The four customer KPIs that matter most are customer lifetime value, customer acquisition cost, the LTV:CAC ratio, and repeat purchase rate. Sales KPIs tell you what happened last week. Customer KPIs tell you whether your business is actually compounding or just churning through one-time buyers at an unsustainable cost.
Customer Lifetime Value (CLV)
CLV is the total profit you expect from a single customer across their entire relationship with your store. The simplest formula for transactional ecommerce is AOV multiplied by purchase frequency multiplied by customer lifespan. Emarsys’ 2026 guide to customer lifetime value benchmarks puts the typical range at $100-$300 for general retail, with luxury reaching $1,500-$2,500 and beauty subscriptions hitting $480-$720.
CLV is not a reporting metric. It’s a budgeting input. Once you know what a customer is worth over their lifetime, you know how much you can afford to spend acquiring one.
Customer Acquisition Cost (CAC)
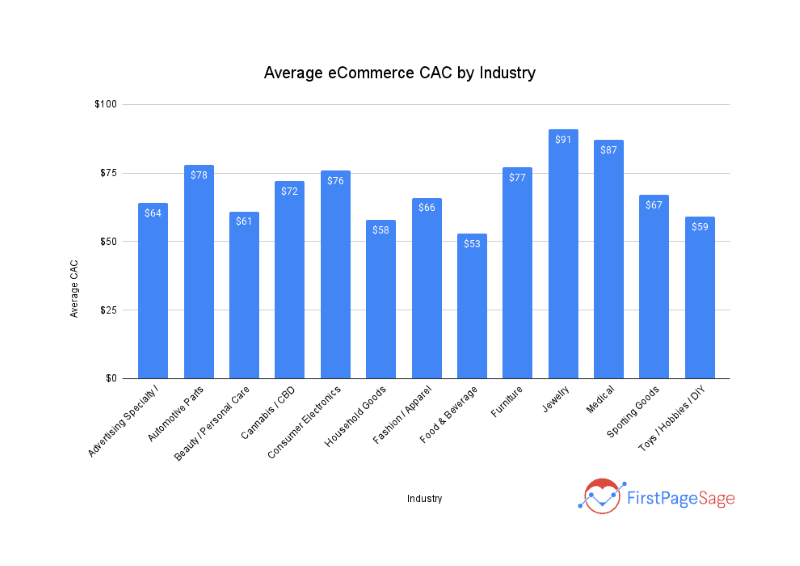
CAC is your total sales and marketing spend divided by the number of new customers acquired in the same period. First Page Sage’s 2026 ecommerce CAC report based on proprietary data from 80+ clients shows acquisition costs vary wildly by industry, from around $50-$90 blended ecommerce average up to $175+ for luxury. Rising acquisition costs mean a large share of ecommerce brands now lose money on the first order and only recoup it if the customer comes back.
Read that again. The average ecommerce brand is losing money on acquisition and making it back only if the customer comes back. That single data point reframes every conversation about growth.
LTV:CAC Ratio
The LTV:CAC ratio divides lifetime value by acquisition cost and tells you whether your unit economics work. The consensus benchmark across Yotpo’s 2026 analysis, Bain, and virtually every ecommerce finance framework I’ve seen is 3:1. Every dollar you spend acquiring a customer should return three dollars in lifetime margin. Below 2:1 the business is structurally unsustainable. Above 5:1 you’re likely underspending on growth.
This is the KPI I check first when I’m evaluating an ecommerce business. It collapses a dozen other numbers into a single truth: is this thing compounding or bleeding?
Repeat Purchase Rate
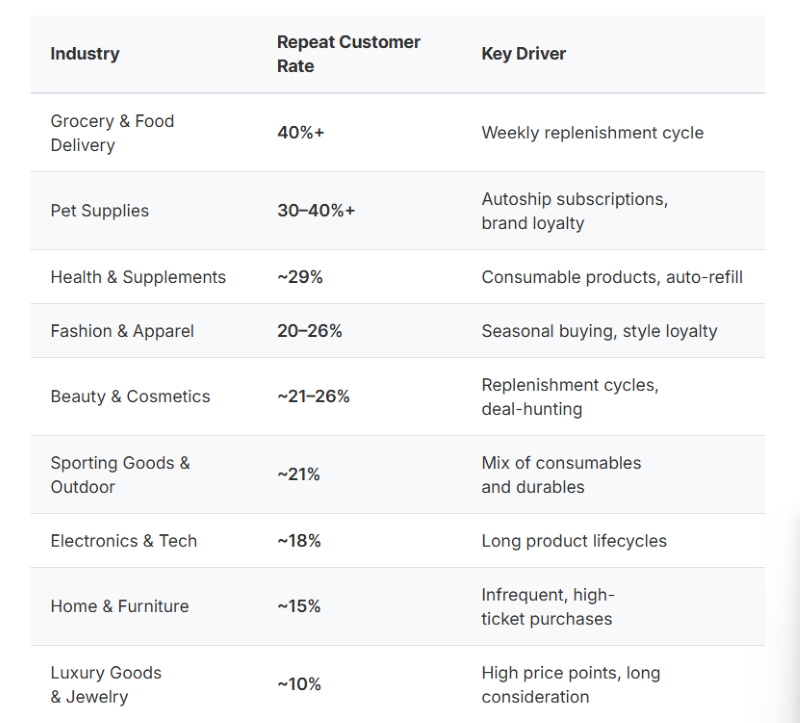
Repeat purchase rate is the percentage of your customers who’ve made more than one purchase. According to Bluecore’s customer growth benchmarks analyzed by Mobiloud, the average sits around 25-30%, with Shopify stores specifically averaging around 27%. Consumable categories (supplements, coffee, skincare) hit 40-55% at top performers. Luxury is the bottom of the barrel at 9.9%.
The math on repeat rate is brutal in the best way. Consider a store with 1,000 new customers per month at $60 AOV. At a 20% repeat rate that’s $12,000 in second purchases. Bump the rate to 35% and you generate $21,000. That’s a 75% revenue increase from the exact same acquisition cost. This is why Bain & Company’s foundational retention research found that a 5% increase in retention can lift profits by 25% to 95% depending on your margin structure.
Retention is the most leveraged lever in ecommerce, and it’s the one most stores don’t measure seriously. I cover the full architecture of turning first-time buyers into repeat ones in my guide to ecommerce marketing strategy.
Which Marketing KPIs Reveal Whether Your Spend Is Working?
The marketing KPIs that matter are return on ad spend, cost per acquisition by channel, and email marketing performance. These answer a simple question: for every dollar leaving your bank account, how many are coming back, and which channels are pulling their weight? Most stores track the blended numbers and miss the channel-level truth.
Return on Ad Spend (ROAS)
ROAS is revenue generated from ads divided by ad spend. A ROAS of 4 means every $1 in ad spend produced $4 in revenue. The number you need depends on your gross margin. At 50% gross margin, a 3 ROAS is roughly breakeven after product costs. At 30% margin, you need 4+ just to stay above water.
Here’s where a lot of brands get burned. They chase ROAS on top-of-funnel campaigns and kill the ones that look unprofitable on a single-order basis. But top-of-funnel ads don’t close sales, they seed brand awareness that converts through email, retargeting, and direct traffic weeks later. ROAS measured at the ad-platform level almost always understates the true return on upper-funnel spend.
Cost Per Acquisition by Channel
Channel-level CAC tells you which acquisition sources are actually efficient. Owned channels like email and SMS, along with organic search and referrals, typically deliver the lowest cost per acquisition because you’re not renting attention from a platform. Paid social and paid search, despite being the default allocation for most ecommerce brands, often sit at the bottom of the efficiency table once you account for the customers who would have bought anyway.
A channel with a high blended ROAS and a high CAC isn’t a channel you should cut. It’s a channel you should understand better, potentially by modeling post-purchase behavior of customers acquired there.
Email Marketing Performance
Email is the most ROI-positive channel in ecommerce, full stop. Welcome series and abandoned cart flows convert at multiples of any acquisition channel because you’re talking to people who already raised their hand. Track open rate, click-through rate, revenue per recipient, and flow-level attribution. The single highest-leverage email in most stores is the first post-purchase order confirmation, which is almost always wasted on receipt-only content when it could be driving the second purchase.
Which Site and Checkout KPIs Expose Hidden Revenue Leaks?
The three site KPIs that expose hidden revenue leaks are cart abandonment rate, add-to-cart rate, and bounce rate. These funnel metrics pinpoint exactly where visitors drop off in your purchase path. Without them, you know conversion is low but you don’t know whether the problem is the product page, the cart, or the checkout.
Cart Abandonment Rate
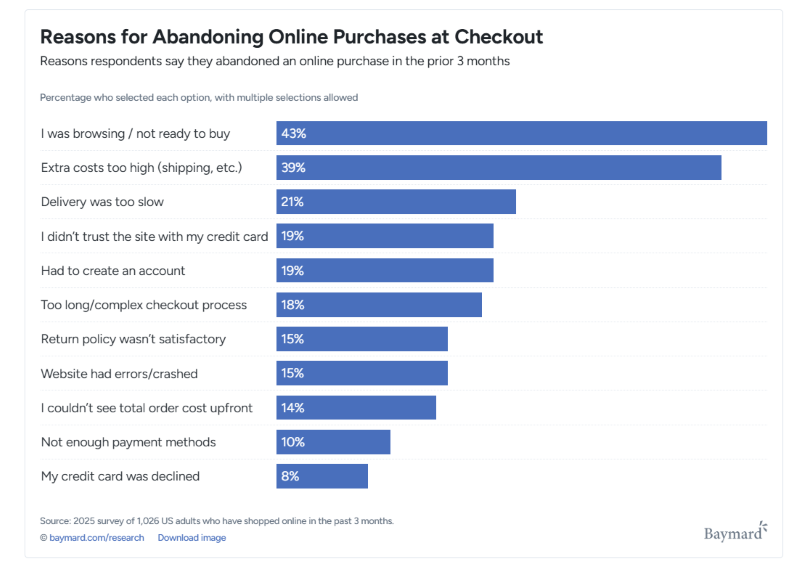
Cart abandonment rate is the percentage of shoppers who add items to their cart but don’t complete checkout. The industry average has hovered at 70.22% for more than a decade, based on Baymard Institute’s meta-analysis of 50 separate studies. Of those who abandon, nearly 1 out of 5 shoppers have abandoned a cart due to a “too long / complicated checkout process” according to Baymard.
Before you panic, know that roughly 43% of abandonments are from shoppers who were just browsing and never intended to buy on that visit. That segment is largely unrecoverable. The other 57% is where the real money is.
As Rashel Hariri, CMO of Foursixty, puts it in their cart abandonment research: “Cart abandonment is not about lack of intent. It’s about unresolved hesitation.”
That framing changes what you do about it. The top documented reasons shoppers abandon carts:
| Reason for Abandonment | % of Shoppers |
|---|---|
| Extra costs (shipping, taxes, fees) | 47-48% |
| Too long/complex checkout | ~18% |
| Limited payment options | 13% |
Source: Baymard Institute cart abandonment research.
Fix the surprise-cost problem alone and you’ll typically recover 5-10% of lost carts. Add Shop Pay, Apple Pay, and guest checkout and you’ll recover more. Shopify’s own data shows Shop Pay alone can convert up to 50% better than standard guest checkout.
Add-to-Cart Rate
Add-to-cart rate is the percentage of sessions where a user adds at least one item to cart. The industry average sits around 7.2-7.5% per DTC Pages’ 2026 benchmark study across 21 Shopify stores generating $688M in combined revenue. Stores with ATC rates above 10% consistently had overall conversion rates above 3.8%.
Here’s why this matters. If your conversion rate is low but your ATC rate is strong, your problem is checkout. If ATC is low, the problem is upstream at the product page, pricing, or product-market fit. The two diagnoses lead to completely different fixes.
Bounce Rate and Engaged Sessions
Bounce rate is the percentage of sessions that ended without any meaningful engagement. In GA4 this has been reframed as the inverse: engaged sessions. High bounces on paid traffic usually indicate a message-market mismatch between the ad and the landing page. High bounces on organic traffic usually indicate a content-intent mismatch. Both are fixable once you know which one you’re dealing with.
I’ve gone deeper on tools and measurement setup in my guide to ecommerce analytics if you want to get specific about tracking implementation.
How Do You Choose the Right Ecommerce KPIs for Your Business?
The right ecommerce KPIs for your business are the 5-7 numbers tied directly to your current top business goal, not an exhaustive list pulled from a benchmarks article. Start with one primary goal (revenue, retention, or efficiency), pick 2-3 KPIs that directly measure it, then add supporting metrics that reveal why the primary KPIs are moving.
Here’s the short KPI selection framework I use with fractional CMO clients:
- Name the goal in dollars or percentages, not adjectives. “Grow faster” is not a goal. “Hit $2M in Q4 revenue at 4:1 LTV:CAC” is.
- Pick one North Star KPI that measures the goal directly. For most ecommerce businesses chasing profitable growth, this is LTV:CAC or RPV.
- Pick 3-4 input KPIs that drive the North Star. If the North Star is LTV:CAC, your inputs are repeat purchase rate, AOV, and blended CAC.
- Pick 1-2 diagnostic KPIs that flag problems early. Bounce rate, add-to-cart rate, and email open rate all qualify.
- Delete everything else from the dashboard. Not every team. Just the executive dashboard.
If your dashboard has more than ten numbers on the main screen, you’re probably tracking, not managing.
What Are the Current 2026 Benchmarks for Ecommerce KPIs?
Here’s a compressed snapshot of the KPI benchmarks I see referenced most across credible 2026 sources. Use them as orientation, not judgment. Your numbers should be benchmarked against your own historical trend first, then against industry averages a distant second.
| KPI | Benchmark (2026) | Top-Performer |
|---|---|---|
| Conversion Rate (global avg) | 2.5-3.0% | 4.7%+ |
| Mobile Conversion Rate | 1.8-2.8% | 3%+ |
| Add-to-Cart Rate | 7.2-7.5% | 10%+ |
| Cart Abandonment Rate | 70.22% | 55-60% |
| LTV:CAC Ratio | 3:1 | 4-5:1 |
| Repeat Purchase Rate | 25-30% | 40-55% |
| Blended CAC (ecommerce) | $68-$90 | Depends on vertical |
Sources: Smart Insights (conversion rate), Qualimero and DTC Pages (mobile conversion rate), DTC Pages (add-to-cart rate), Baymard Institute (cart abandonment), First Page Sage (CAC), Mobiloud’s repeat customer benchmarks (repeat purchase rate), and Yotpo’s 2026 ecommerce benchmarks (LTV:CAC).
One caveat I have to highlight: these are blended averages. According to Convertibles’ 2026 conversion rate benchmarks by industry, the ecommerce conversion rate in luxury is 0.8-1.2% while food and beverage hits 4.5-6%. Don’t benchmark outside your vertical.
The starting ecommerce analytics stack for most stores is Google Analytics 4 for traffic and conversion tracking, Shopify Analytics or equivalent platform analytics for order and customer data, and a heatmap tool like Hotjar or Crazy Egg for qualitative session analysis. Most stores don’t need more than these three to answer 80% of their strategic questions.
Beyond the basics, three capabilities tend to matter as you scale:
- Cohort analysis, for tracking LTV and repeat rate by acquisition month. Mixpanel and Amplitude handle this well.
- Attribution, for understanding which channels actually drive sales beyond last-click. Triple Whale, Northbeam, and Rockerbox are the leaders here.
- Email and retention analytics, where Klaviyo‘s native reporting remains the gold standard for DTC brands.
I’ve broken down the full analytics tool landscape in my ecommerce analytics guide, including pricing and use cases for each tool.
One word of warning. More tools don’t produce more insight. They produce more dashboards, more discrepancies between dashboards, and more arguments about which number is right. Start lean. Add a tool only when you’ve identified a specific decision the existing stack can’t inform.
What Are the Biggest Mistakes Brands Make With Ecommerce KPIs?
The six mistakes I see most often as a Fractional CMO:
Tracking too many KPIs. A dashboard with 40 metrics has zero KPIs because nothing stands out. Cut to 5-7 and you’ll start actually moving them.
Benchmarking against the wrong averages. Your conversion rate compared to “global average” is meaningless. Your conversion rate compared to your own 12-week trend, segmented by device and traffic source, is actionable.
Obsessing over conversion rate while ignoring AOV. I’ve seen brands optimize for more transactions and accidentally tank profitability. A 3% CR at $150 AOV beats a 4% CR at $75 AOV. Every time.
Treating CAC as a standalone number. CAC only means something relative to LTV. A $200 CAC with an $800 LTV is excellent. A $40 CAC with a $50 LTV is a business dying in slow motion.
Ignoring retention until acquisition breaks. Most ecommerce brands spend 80% of their attention on the top of the funnel and wonder why their P&L is fragile. Retention compounds. Acquisition doesn’t.
Measuring without acting. The point of a KPI is to trigger a decision. If you’ve tracked the same declining number for six months without changing anything, it isn’t a KPI. It’s wallpaper.
Frequently Asked Questions About Ecommerce KPIs
Five to seven on the executive dashboard, with team-level dashboards going deeper as needed. The discipline is not about tracking fewer metrics overall. It’s about ruthlessly limiting which ones get executive attention. I have worked with stores tracking 20+ KPIs and acting on three of them. The other 17 are anxiety, not information.
For most stores pursuing profitable growth, it’s LTV:CAC ratio. This single number collapses acquisition efficiency and customer retention into a truth about whether your business model actually works. If you had to pick just one, this is it. Revenue per visitor is a close second because it combines conversion rate and AOV into one meaningful number.
A new store with unoptimized traffic should expect to land below the global average while you’re still finding product-market fit, often in the 1-2% range. Hitting 2% consistently means your funnel is working. Above 3% means something specific is working unusually well and you should figure out what it is before it breaks.
Daily for leading indicators like traffic and sales. Weekly for conversion funnel metrics. Monthly for retention, CLV, and LTV:CAC. Quarterly for strategic direction and KPI selection itself. The cadence matters because some KPIs are too noisy to read daily and some are too slow-moving to be useful monthly.
Subscription businesses should layer monthly recurring revenue, churn rate, and cohort retention curves on top of the standard ecommerce KPI set. CLV becomes easier to calculate but churn becomes the single most important input. A 1% monthly churn improvement in a subscription business produces dramatically more profit impact than a 10% conversion rate improvement in a transactional one.
Ready to Build an Ecommerce KPI Dashboard That Drives Real Growth?
The fastest way to transform an ecommerce business isn’t to add more data. It’s to subtract. Pick your North Star, pick three inputs that drive it, pick two diagnostics that warn you when something’s breaking, and delete everything else from the main screen. You’ll be in the minority of ecommerce brands who actually manage by KPIs instead of just tracking them.
If you want a deeper framework for building a digital-first marketing engine that ties KPIs directly to strategy, I wrote the Digital Threads book exactly for that purpose. It’s a step-by-step playbook for small businesses and ecommerce brands that want to stop guessing and start compounding. You can also subscribe to my weekly Digital First newsletter where I break down what’s actually working in ecommerce marketing right now.
If you’re an established ecommerce brand wrestling with weak LTV:CAC or flat retention, my fractional CMO practice exists to solve exactly those problems. And for brands pursuing marketplaces alongside DTC, I’ve also written about Amazon marketing strategy elsewhere on the site.
Pick your KPIs. Track them honestly. Act on them decisively. That’s the whole job.
Actionable advice for your digital / content / influencer / social media marketing.
Join 13,000+ smart professionals who subscribe to my regular updates.