
What Is Conversion Rate And How It Is Measured
Instagram likes are great. Facebook followers are nice. Clicks on your product page are cool. But none of it means anything if these people aren’t somehow converting. But what is a conversion rate, exactly, and how do you calculate it for your own business? Let’s get into all the details.
What is Conversion Rate?
When we say “conversion rate,” it can actually mean a number of things. However, at a very broad level, when marketers talk about conversion rate, it refers to the number of users who took your desired action divided by the total number of users. You multiply this number by 100 to get the percentage.
As we said, a conversion can refer to many different things, but here are a few common examples:
- Clicks
- Purchases
- Sign-ups
- Installs
- Creating an account
- Submitting a form
Conversions can be applied in countless ways. For example, let’s say we’re talking about your SEO conversion rate. Perhaps you have a page ranking third in Google SERPs and the page now gets 50 clicks/visits a month. On that page, you have a form where people can sign up for your newsletter, and that gets 10 sign-ups a month.
10 sign-ups / 50 clicks = 0.2
0.2 x 100 = 20%
Our conversion rate, in this case, is 20%.
Importantly, the conversion rate doesn’t only refer to sales/revenue. There are infinite types of conversions. You might be looking at how many website visitors convert into email sign-ups, or how many Instagram followers convert to clicks on the link in your bio. The point is that a conversion means the user took some sort of pre-defined action that has value for the business.
Why Should You Care About Conversion Rates?
Great question! As we mentioned earlier, looking at metrics like social media post likes, numbers of followers, and link clicks is a good start, but it doesn’t nearly tell the whole story.
Let’s think about an extreme example. Let’s say you’ve got a page on your website ranking first in Google—the most coveted spot. This should be a huge win for you. You get 300 clicks from the SERP… but nobody who landed on the page clicked the free trial button to test your product. What gives?
Well, we can’t know for sure, based solely on this information. But there’s a good possibility that the page simply isn’t enticing enough to get people to sign up. We’d need to do more to incentivize them. What do they get when they sign up? That should be highlighted more.
Again, this is an extreme example, but the point is this: The top-ranking position and 300 clicks are largely pointless if not a single one ultimately converts to a sign-up, which is necessary if this brand wants to grow.
Knowing your conversion rate(s) also tells you where you’re excelling and what you need to improve—especially when you combine it with other metrics. (Keep reading. We’ll get to that in a moment.) Importantly, it can help you to lower the cost of acquiring new customers and also get the customers you have to spend more, essentially increasing the value of each customer.
Lastly, while conversions represent a single action/event, we can look at them from a broader perspective: conversion funnels—sometimes called sales funnels. This represents the journey your users go on as they move toward your desired conversion. Your funnel might start with a lead magnet that they opt into and ultimately end with them purchasing your product. The sales funnel can reveal what your users like about the journey, and conversely, where they drop off.
Let’s keep going. We need to explore another important question.
What is a Good Conversion Rate?
In order to know if your own conversion rates are on the right track, you have to have an idea of what they should ideally be.
So, what is a good conversion rate? To give you a rough idea, 10% is what you generally can aim for.
To be clear, the conversion rate you’re aiming for is going to depend on a number of factors, including:
- The medium: Your website ideally ranks in Google and converts the people who find you in search results to loyal users. Organic Google traffic is typically a huge source of traffic for brands. Conversions from social media have gone down over the years as the platforms have become more competitive, but they’re still excellent for building brand recognition. Email marketing is incredibly profitable with a high ROI, because the people on your list are warm or hot leads and already loyal to your brand.
- The goal of that medium: A common goal for email marketing is getting subscribers to purchase, since these relationships have already been nurtured. The goal of a website’s homepage, on the other hand, might be to get users to opt into a freebie. Within social media, a common goal is to get followers to like, comment on, or share a post, since this greatly increases the brand’s exposure.
- Your industry/niche: Conversion rate can easily fluctuate depending specifically on how big an audience you’re trying to reach is. For example, with a more niche industry—and thus, target audience—you might expect a higher conversion rate. However, with a broader (read: larger) audience, your conversion rate might understandably be lower.
Looking at these various factors will help you to better determine what an average conversion rate should look like, based on your needs and goals.
First, let’s explore target conversion rates by medium:
- PPC: 10% is a good CR (average: 2.35%)
- SEO: a good CR is 16% (average: 2.4%)
- Email marketing: 2-5% is considered good (average: 1.33%)
- Affiliate marketing: 10% is above average (average: 0.5-1%)
- Social media marketing: 2-5% is ahead of the curve (average: 0.71%)
Bear in mind what we said earlier about how there are various factors at play. The percentages you see are going to be different from one another because each medium is different, with their own unique goals and methods.
These are very general percentages but at least they give you a rough idea of what you should be aiming for.
We can also break down these numbers by industry and type of industry. Here are rough averages:
- B2B
- SaaS: 1.1%
- Shipping and logistics: 2.7%
- HVAC: 3.3%
- Staffing services: 5.1
- Legal services: 7.4%
- eCommerce: 3.25%
- Tech: 1.5%
- B2C
Rather than using these percentages as your benchmarks, consider them as guidelines. Again, there are a lot of variables and moving parts, and a good conversion rate for one fashion brand, as an example, might be different from a good rate for another fashion brand.
14 Other Conversion Metrics to Track
We mentioned earlier that you should actually be monitoring your conversion rates alongside other related metrics. Let’s talk about those next, because combining multiple metrics is going to give you a much more accurate read.
1. The Traffic Source
You might not think that your traffic source matters when it comes to conversions, but it can actually give you valuable insights. Specifically, it can help you understand how each medium can help you connect and interact with its respective users.
For instance, if most of your traffic is coming from, say, Instagram, and your conversion rate is very low, that might be because Instagram users are ultimately more interested in that instant gratification of seeing your posts in their feed, but not engaging with you further.
On the flip side, you might find that organic traffic coming from Google has a noticeably higher conversion rate. This could be because people are actively searching for the solution you offer by typing a query into the search engine and finding your website.
2. Audience
What is the average age of your users? Do you notice that they’re overwhelmingly located in one specific area over any others? Understanding your audience can help you determine their needs, understand how actually they are converting, and thus, how you can best reach them.
3. Behavior Flow
Behavior flow shows you the path your users take from page to page and where your main conversion page is located on this path. It’ll help to reveal where you’re losing people and generally how visitors navigate through your website.
4. The Conversion Rate for New vs. Returning Visitors
Conversion rate for new visitors can be very revealing because it tells you what users’ first impressions are when they land on your page. Especially when you combine this with other metrics, like bounce rate (more on that in a minute), it can answer one important question: Are people seeing the value in what we provide, or do they quickly lose interest?
As an example of how you can apply this, consider comparing two landing pages on your site. Which one converts more new users? Use that insight to improve the other page.
While you might have a harder time converting new visitors, returning visitors should be another story. If people keep coming back to your site over and over again, it’s a good sign! It means they’re interested. However, if they don’t ultimately convert, something’s off.
Every time someone returns to your page, you’re nurturing that lead. Make sure you’re continuing to move them toward a conversion. Returning visitors are immensely valuable.
5. Time Spent on Page
Do users spend an average of two seconds on a page before leaving? There’s not a whole lot they can accomplish in that amount of time. In other words, the conversion rate will suffer.
However, if they’re spending more time on the page—maybe a few minutes—there’s a better chance that they’re getting to know and trust you, and will take some sort of action to convert (like sign up for your email list or purchase a product).
Generally, the longer you can get people to stay on your page, the better—as long as, at some point, they take action. If you notice that users spend a long time on your page but don’t convert, something is your conversion flow could be problematic for them.
6. Bounce Rate
The bounce rate calculation of a web page reflects how many people land on it and then leave, as opposed to clicking onto a second page on that site. A high bounce rate means a lot of people leave after visiting the page. A low bounce rate means a lot of people continue onto another page. It is usually considered that the lower the bounce rate, the better. However, it is not always true, especially for analyzing your conversion rate.
To be more specific, we need to consider two scenarios here. If the page in question is a product page that users can directly purchase from, the bounce rate isn’t as important. They can purchase and leave the page right after, and you still made a sale.
However, let’s say it’s a blog post, and that blog post links to a product page. If the bounce rate for the blog post is high, it means that not a lot of people will ever even get to that product page.
This is also a good time to remind you of the relationship between SEO and sales, specifically. Among all the traffic channels, SEO is the most capable of bringing purchase-ready users to your site. If you target keywords with commercial or transactional intent, users landing on your page already know pretty well what they are looking for. So the more optimized a page is, and the more it meets the user’s intent, the more you’re going to attract the right people to that page. Thus, they’ll be more likely to click onto another page on your site and continue engaging with you. Remember, we don’t just want traffic. We want targeted and high-quality traffic.
7. Landing Page
Your landing pages’ performance can significantly inform your approach in other areas of your digital presence. SEO-friendly landing pages tend to bring plenty of traffic to the website. What you need to analyze is which exact pages are driving most of the visitors to your site. To measure the impact such pages have on your bottom line, you’ll need to answer more questions. How much time are people spending on them? Subsequently, which is the highest-converting? Use this information to improve other pages on your site.
8. Exit Pages
The exit page is the last page a user visits before leaving your site. Knowing your exit page can help you understand why your conversion rate is soaring—or flatlining. For example, let’s say that in order for a user to purchase a new pair of pants from a men’s apparel company, they have to go through four pages:
- The initial product page.
- Their cart.
- The purchase page, where they input their details and card number.
- Thank you page.
If the brand finds that the cart is the most common exit page, probably something is off technically or in terms of UX, which prevents users from completing a purchase. In this case, these would-be customers are never going to convert.
9. Value Per Visit
Put simply, this refers to what a user’s single visit is worth. For instance, let’s say that your shop page gets 100 visits a day, your conversion rate is 2%, and the average shopper spends $75. This means that each visit is worth $1.50.
100 visits/day x 2% (0.02) conversion rate = 2 visits/day that convert
2 visits/day x $75/visit = $150
$150 / 100 daily visits = $1.50/visit
To make the calculations on a larger scale, you may need to use special tools. For example, SE Ranking’s SEO Potential tool allows you to get income estimates for all your target keywords. All you need is to set the conversion into sales rate and the amount your average shopper spends. The tools will calculate the number of visits from Google for all your target keywords and will provide you with estimated income data. By further dividing your estimated income number by traffic forecast, you’ll get a sitewide value for visit metrics.

Knowing this number further helps you understand how much room you have to spend to acquire a single conversion. Let’s get to that one next.
10. Cost Per Conversion
This refers to how much it costs to make a user convert. While this metric can be tricky to calculate, the bottom line is this: If it costs you more to convert a user than that user is actually worth, your business is losing money. This is why, in the case of paid ads especially, you have to know how much you spend to get a single person to click and purchase. Are you getting an appropriate return?
All of these metrics are incredibly valuable, and they’re available to you through powerful and robust tools like Google Analytics. Learn more about setting up Google Analytics.
11. ROI
Return on investment (ROI), put very simply, measures what you earned compared to what you put in.
Very commonly, ROI is used in a financial matter. For instance, if it costs $1.00 to get a link click, and that person who clicked purchased a product for $5.00, you made $4.00 on your investment.
However, a “return” can really refer to any output, financial or otherwise.
12. CPL
Cost per lead (CPL) is how much you pay for a sign-up, follower, or any other type of lead, typically through an advertisement. This number matters because you don’t want your CPL to be higher than your ROI.
13. New Users
How many new people are you bringing to your page/site? In order to have a healthy conversion rate, you’re going to need a steady flow of traffic. Ideally, it should consistently increase over time.
14. CAC
Customer acquisition cost (CAC) is similar to CPL, except it refers to your total marketing spend divided by your total number of new customers.
Conversion Rate in Google Analytics
Knowing your numbers will be essential in the health of your business as a whole. In Google Analytics, they call a conversion a “goal.” You can set up goals that are specific to your business, and Google Analytics will track them for you. For example, a goal might be a page visit, click, or file download. Be sure to assign a monetary value to each goal, so that you can ultimately determine if it’s performing how you need it to.
Let’s talk about how you can set up and track conversion rates in Google Analytics.
You first need to create goals so that GA knows exactly what to monitor. On your dashboard, click “All Website Data.” Then, look to the menu on the left. You should see “Conversions,” and under that, “Goals.” Click there.

You should then see an option that says “New Goal.” This is where you’re going to tell Google Analytics what you want it to track. You can choose from:
- Using a goal template: These help you set standard, actionable goals, like revenue, acquisition, inquiry, and engagement. If you’re new to Google Analytics, explore this option first.
- Creating a custom goal: This will give you a little more flexibility and allow you to designate settings like destination, duration, or event.
- Creating a smart goal: This allows you to optimize your ads’ performance by using your best sessions as your conversions.
Additionally, you’ll need to set your goal value, which means that you give it a monetary number so that you have a way to compare conversions and measure them over time.
Lastly, you’ll verify your goal. Google Analytics will take your data from the past seven days to calculate a conversion rate for you.
In a nutshell, you’re telling GA (1) what to track and (2) what a good conversion rate looks like.
This is data that you can expect to refine over time as Google Analytics has a better chance to learn about the people who are visiting your website, as well as the actions that they’re taking.
When you want to check up on the progress of your goals, head to Conversions, on the Goals menu, and you’ll see three visual reports: Reverse Goal Path, Funnel Visualization, and Goal Flow.
These reports show you the sequence of steps visitors go through before they ultimately convert. You can use them to pinpoint where visitors enter your funnel, where they drop off, and what sequence of steps is converting the best.

On top of that, you can integrate your Google Analytics account with SE Ranking to have all the key data on conversions in relation to traffic sources, audience and site pages conveniently placed on a single dashboard.
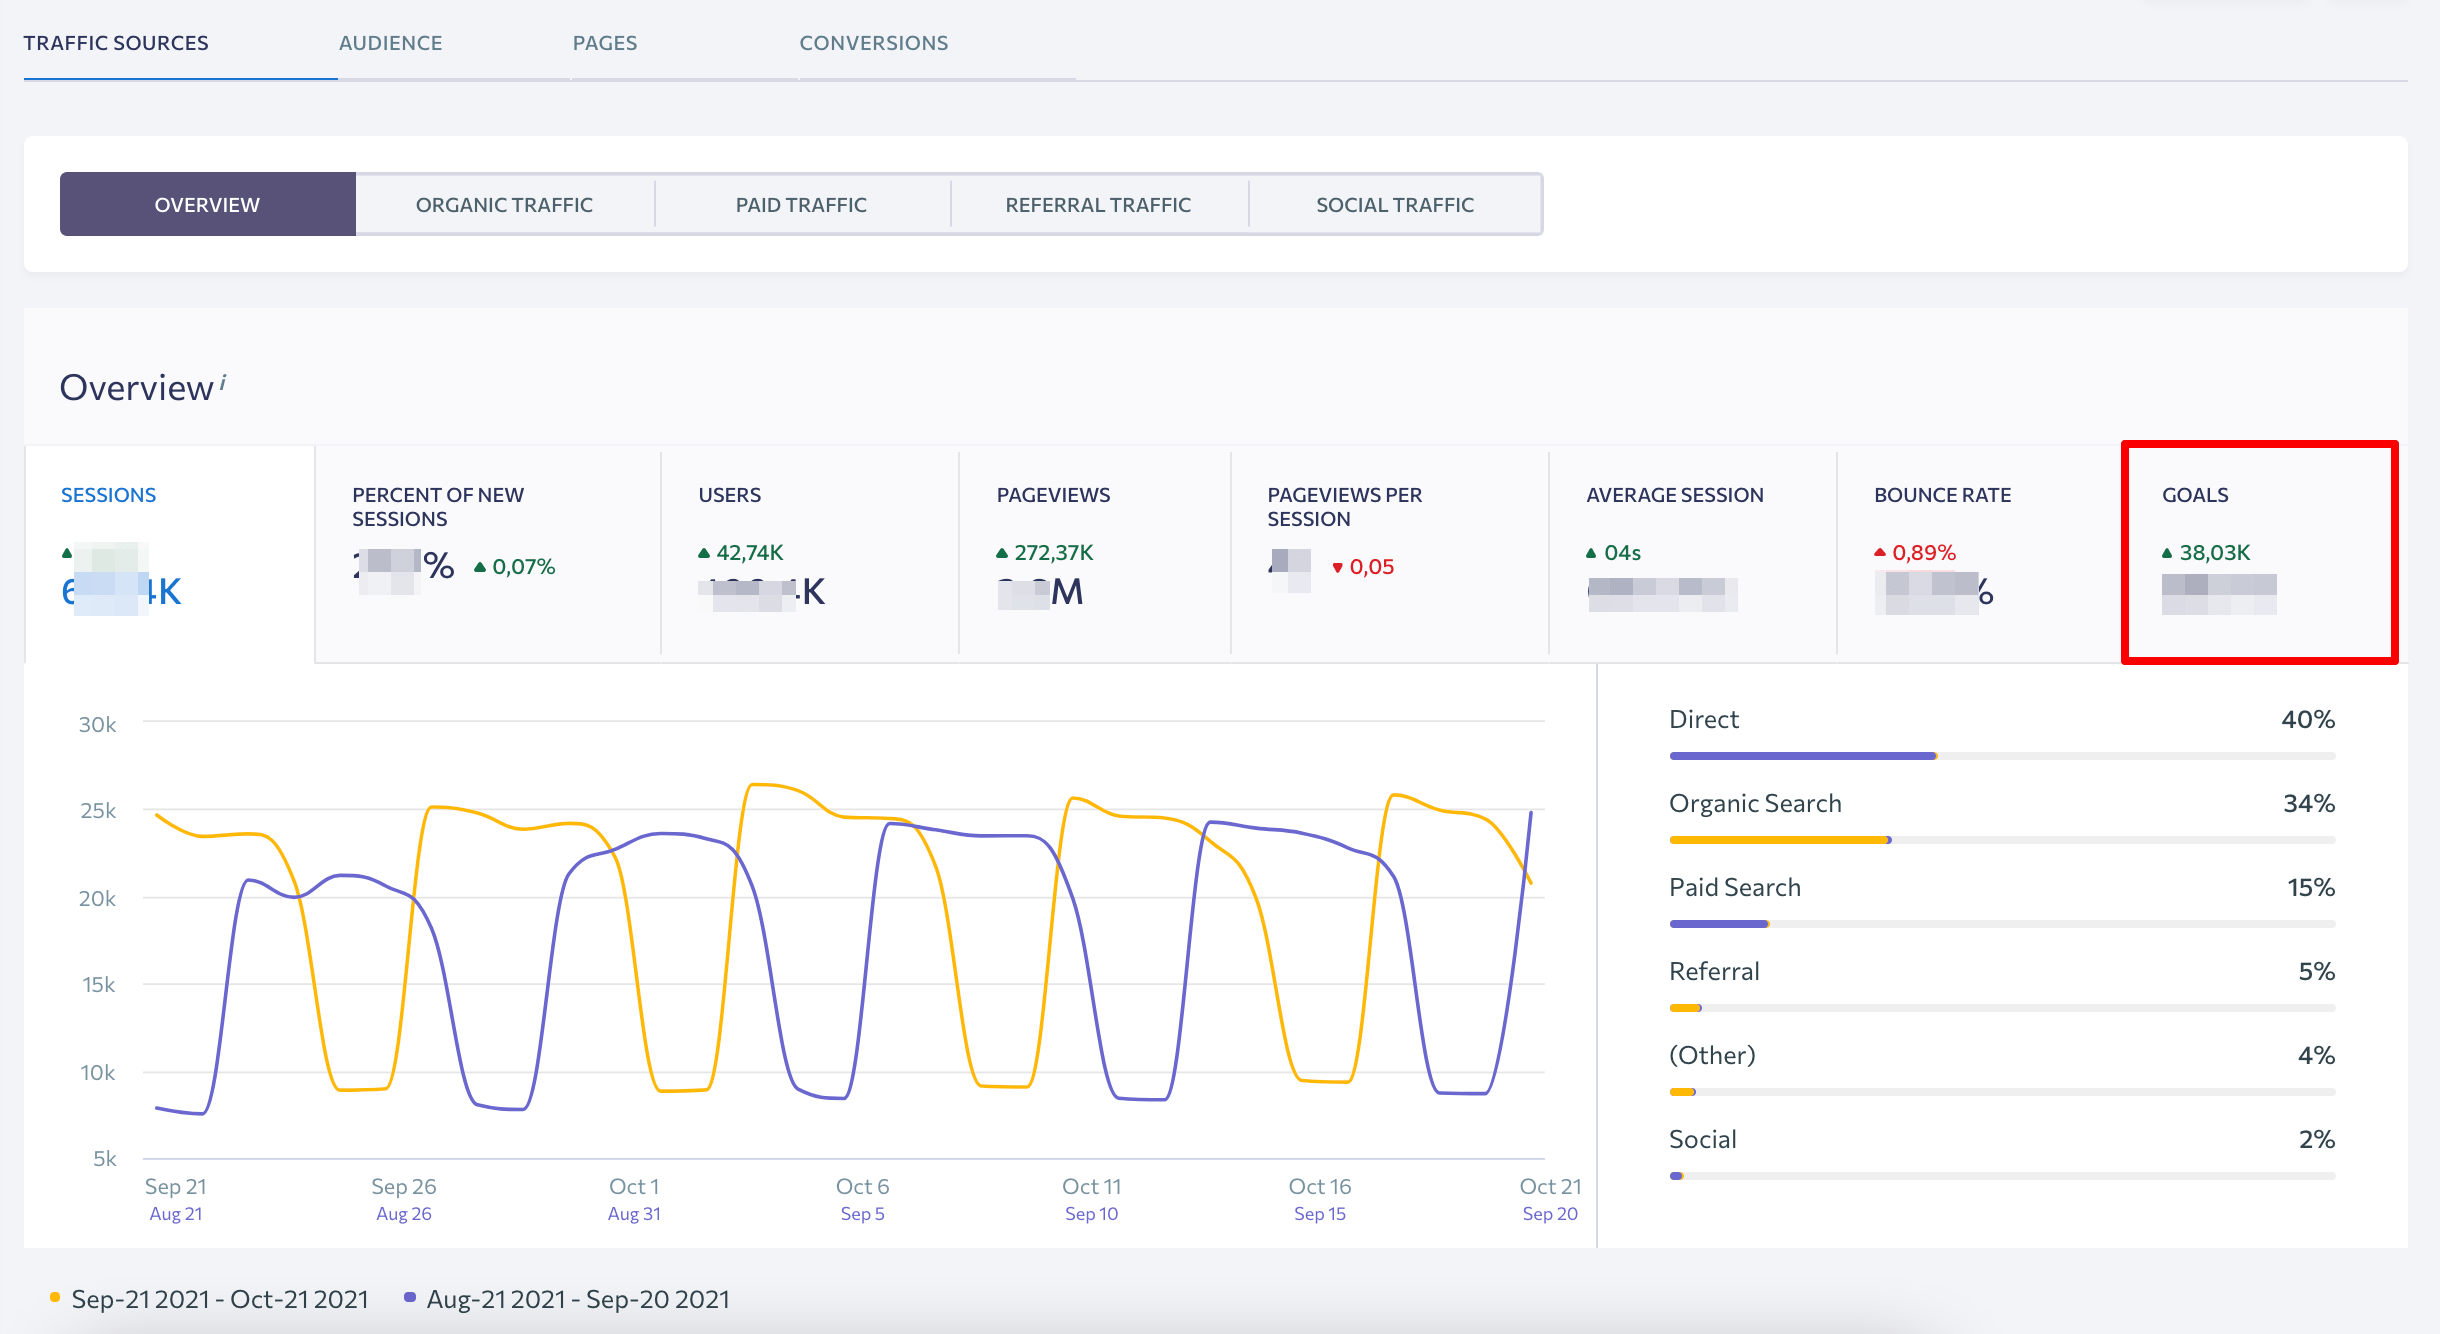
The graph features all the key analytics metrics, and you can find detailed data in the table below. All the data is provided in comparison with a previous period, which can be set according to your needs.
Other tools to track and optimize conversion rate
Besides Google Analytics, you can use dedicated behavior tracking tools such as Hotjar, Lucky Orange, Crazy Egg and the like. They will allow you to not only track the number of conversions and the major steps your users take along the funnel, but to get a full picture of how users interact with your site. Heatmaps and session recordings should give you an idea of what prevents users from converting at a higher rate. We’ve prepared a separate full guide on optimizing the conversion rate, so make sure to check it out.
The Bottom Line
In this blog, we got into all the nitty-gritty about the conversion rate: what it is, why it matters, what types of numbers you should be striving for, and how to calculate/track it.
You also now understand how the conversion rate, while important, isn’t the end of the story. To truly understand the health of your website and its performance, you must look at the conversion rate in the scope of several other metrics.
When you take a step back and examine not just your conversion rate but also what it looks like in the context of the other metrics we discussed, you’ll learn these important things about your website:
- Who are our visitors?
- What are they spending a lot of time on?
- What do they seem to not care about?
- What pages are so enticing that they get our users to take action?
- Where are we excelling?
- What and how can we improve?
If you answer these questions, the performance of your website—and your bottom line—will skyrocket. Data is everything!
Post Views: 571