
The Complete Guide for Marketers
Before you finish reading the words Twitter analytics and doze off, stay with me, this is important for your business. The secret to unlocking your social media growth potential is in your Twitter analytics.
Seriously.
Keep reading to find out what your audience wants, identify your best-performing Tweets and unlock the key insights that will help you refine your social media marketing strategy.
In this complete guide to Twitter analytics, you’ll learn:
- The most important Twitter metrics to track
- Why you should track them
- 5 tools that will save time and speed up growth
- And, how the heck to even use Twitter Analytics
What are Twitter analytics?
Twitter Analytics allows you to track and view key metrics, like follower gain/loss, impressions, engagement rate, retweets and more. The tool has been around since 2014 and is available to all Twitter users, including both personal and business accounts.
Using Twitter Analytics for business helps you make data-driven decisions about your social media strategy. Armed with data, you can optimize your Twitter campaigns to get better results and more followers without guessing whether your plan will work or not.
The benefits of tracking Twitter analytics
The 3 main benefits of using Twitter Analytics are:
Learning what your audience really wants
Through Twitter analytics, you’ll find valuable audience insights that will tell you what your followers respond to the most. Text posts? Photos? Video? Polls? Cat GIFs? All of the above, but only on Sundays?
Without data, you’ll never know for sure what type of content will be a hit and what will miss the mark.
Tracking your growth
Ditch your spreadsheets and leave the math to Twitter analytics. Track your follower gain or loss per month and see growth trends over time.
Having analytics data lets you see what types of content are getting you new followers (or turning people away).
Figuring out the best time to post
When I meet a friend for dinner, the first question they ask isn’t how I am. They ask me, “What’s the best time to post on Twitter?”
OK, not really. But that’s what you want to know, right? The secret is that there’s no perfect time for everyone. It depends when your audience is online and if they span multiple time zones.
With Twitter analytics, you can tell when your Tweets are getting the most engagement. You’ll be able to see patterns for what times of day work best. Don’t stress too much about it, though: 42% of American users check Twitter once a day, and 25% check it several times a day.
Want the easy answer? Alright, alright, the best time to post is 8 am on Mondays and Thursdays. Happy now?
What can you track with Twitter analytics?
Here’s what you can find out with Twitter analytics.
The dashboard page
This is what you see when you first navigate to Twitter analytics. It shows you a monthly overview of your top stats, including your:
- Top Tweet (by number of impressions)
- Top mention (by engagements)
- Top media Tweet (ones that include an image or video)
- Top follower (the person with the most followers who started following you in the current month)
It also includes a short summary of your activity that month.

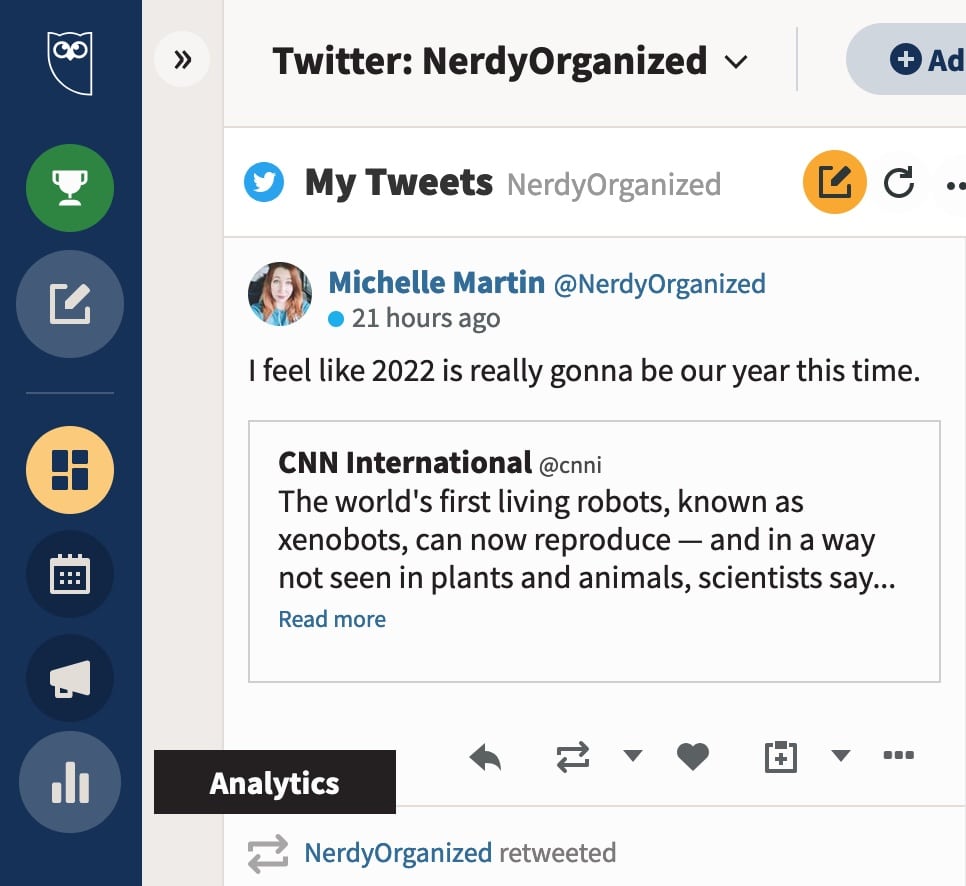
The Tweets page
Next up along the top menu is Tweets. As you can see from my Twitter account, I struck gold on November 23, earning higher impressions than I usually do. The graph is a helpful way to quickly see content trends at a glance.
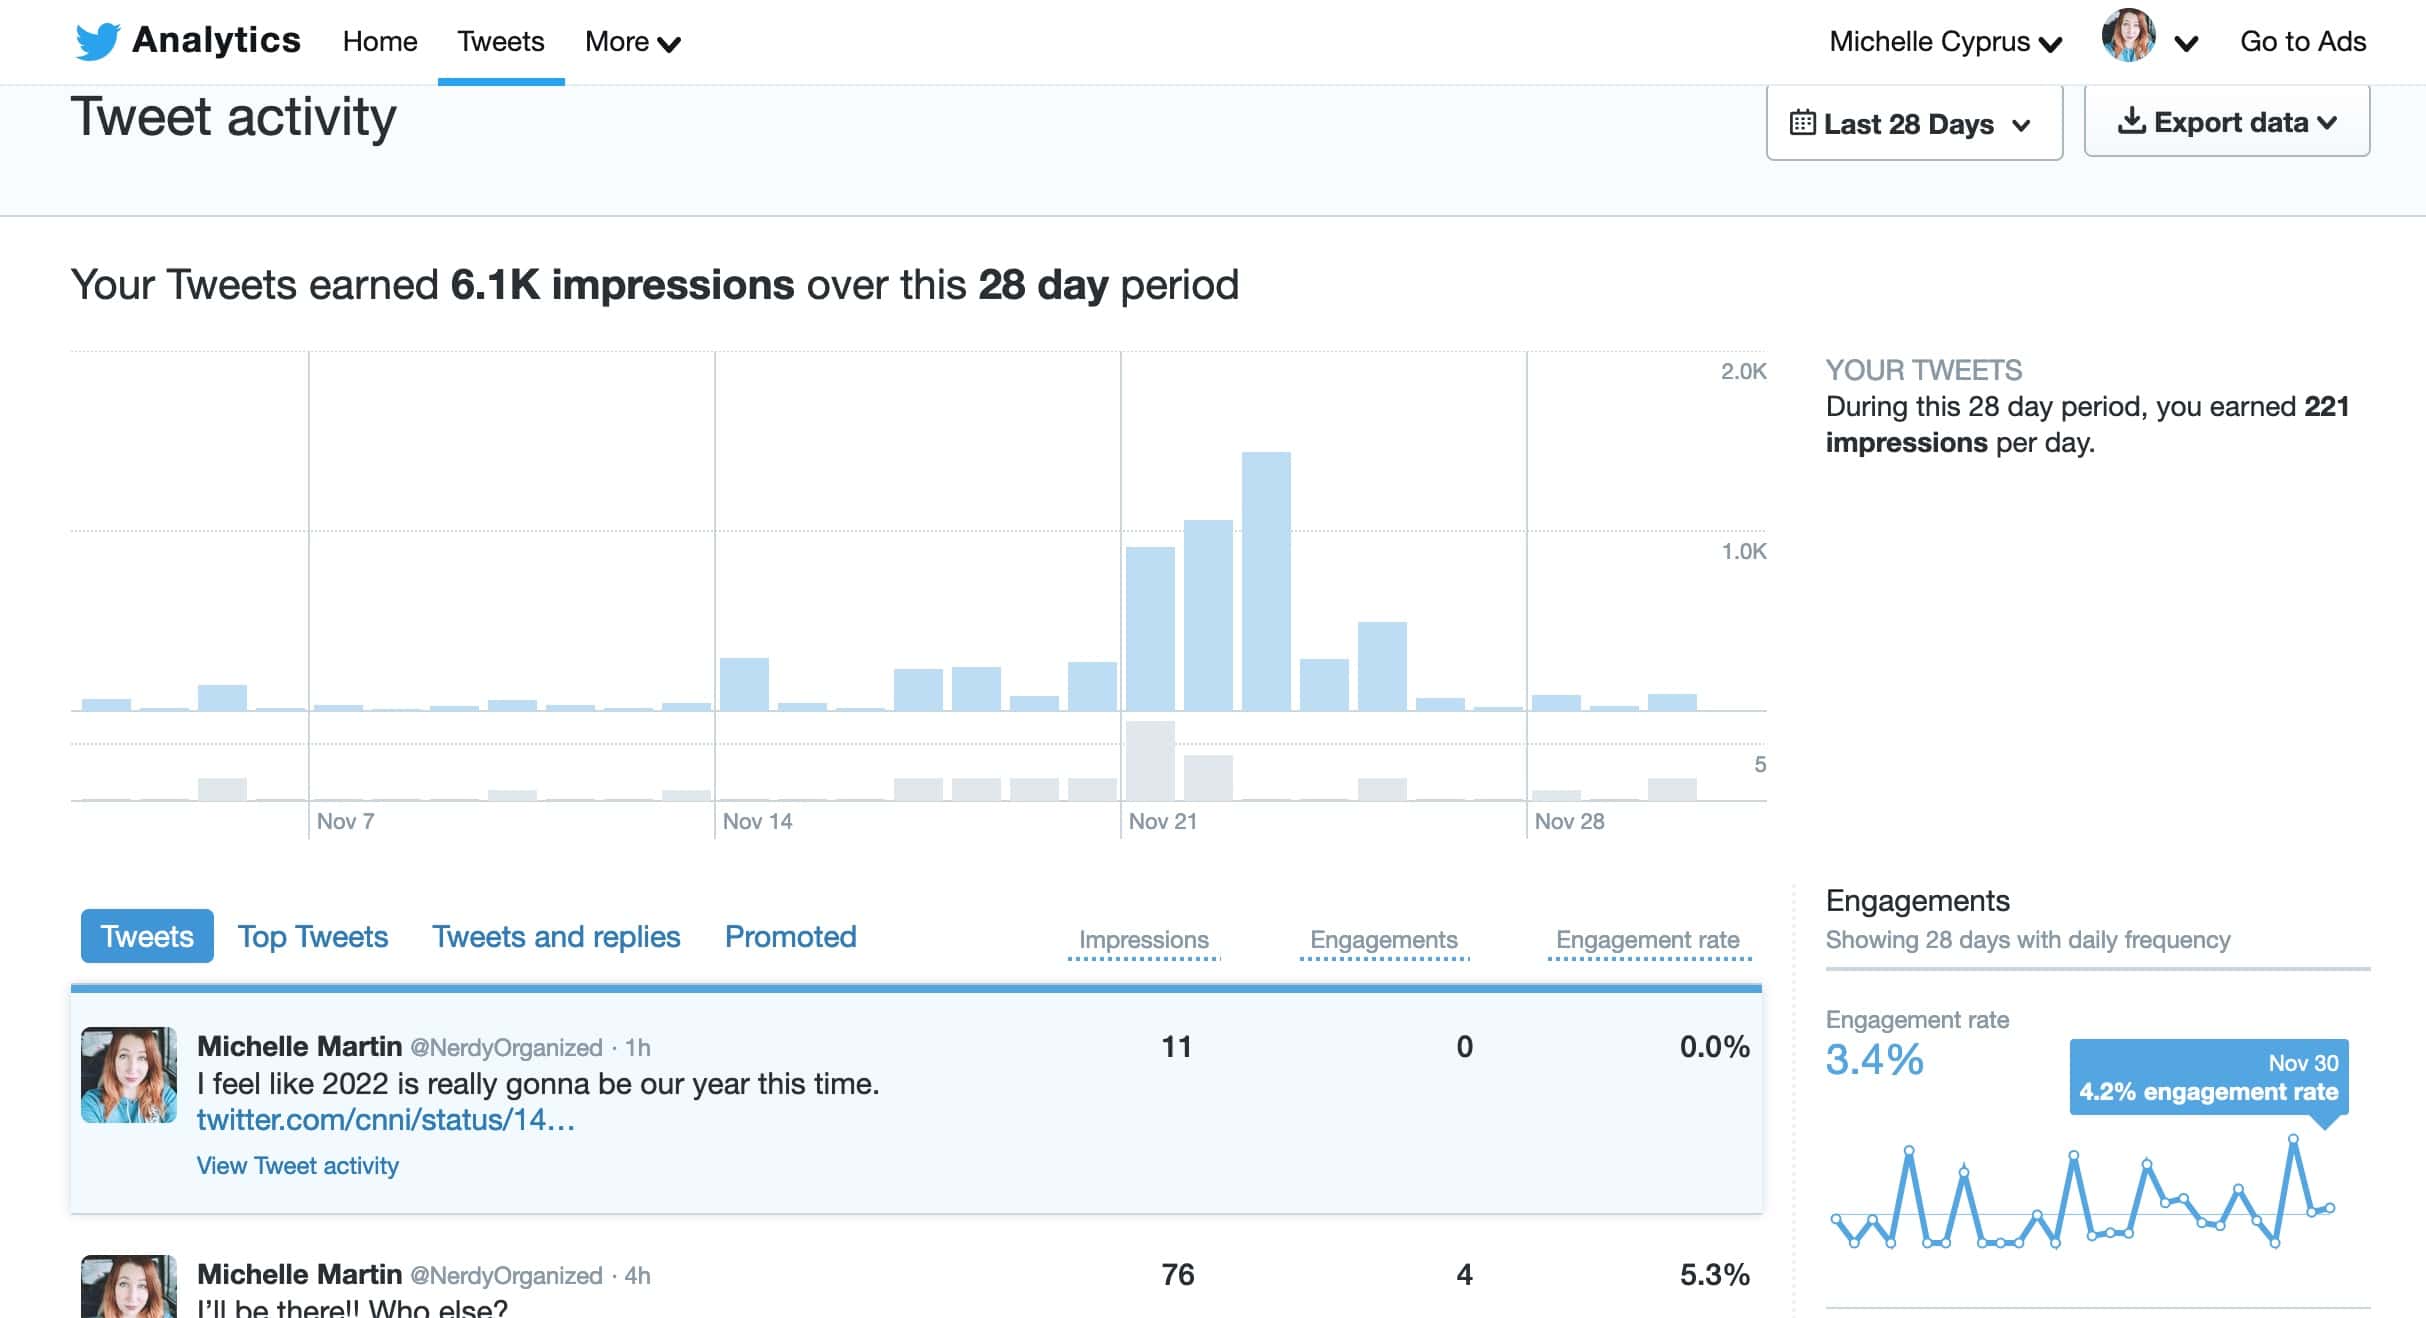
You can see all your Tweets’ impressions and engagement rates in the chosen time period, which defaults to the past 28 days. This is also where you view stats on your Promoted Tweets (paid advertising).
Along the right side, you can also view your average:
- Engagement rate
- Link clicks
- Retweets
- Likes
- Replies
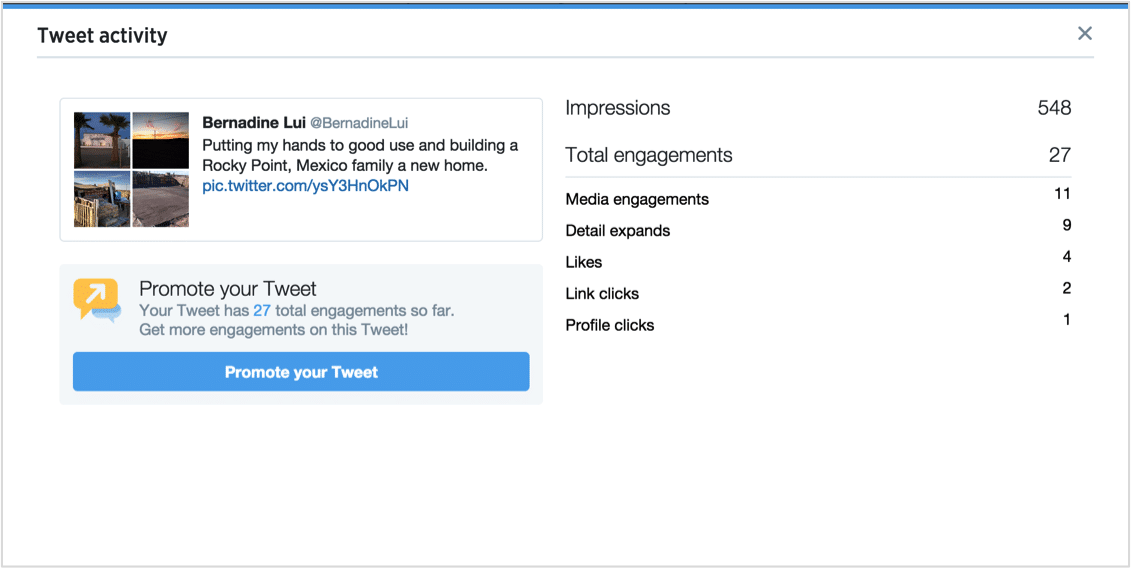
You can also click an individual Tweet for detailed statistics:
The video page
Under the “More” tab at the top, you’ll find the video page. However, this page only shows stats for video content uploaded via Twitter’s Media Studio or for Promoted video ads.
Like the Tweets page, you can view similar video engagement stats here:
- Views
- Completion rate (how many people watched until the end)
- Total video minutes viewed
- Retention rate
You can also see more detailed analytics in Twitter’s Media Studio, like when your audience is online and the top Tweets and comments people are saying about you.
The conversion tracking page
Also under the “More” tab is the conversion tracking page. To use it, you first need to set up Twitter conversion tracking on your website. After it’s set up, you’ll see conversion data for Twitter Ads here and can export it as a .CSV file.

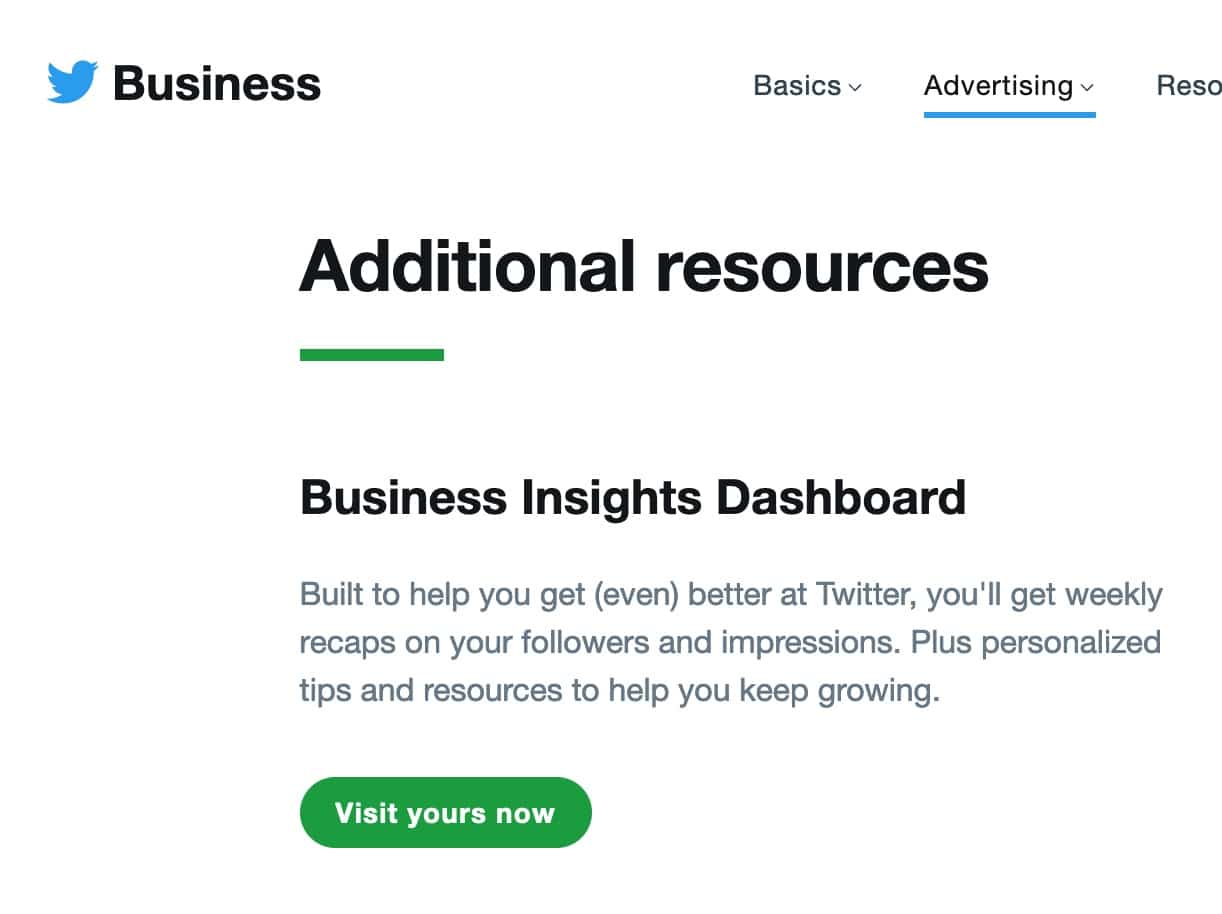
The Business Insights Dashboard
Finally, Twitter has a personalized Business Insights page. “Oh, is it located somewhere easy to find and/or within the rest of the Twitter analytics dashboard?” you may ask, and the answer is no, not at all.
I actually stumbled upon it by accident. You can find it in the Twitter for Business section under Advertising -> Analytics.
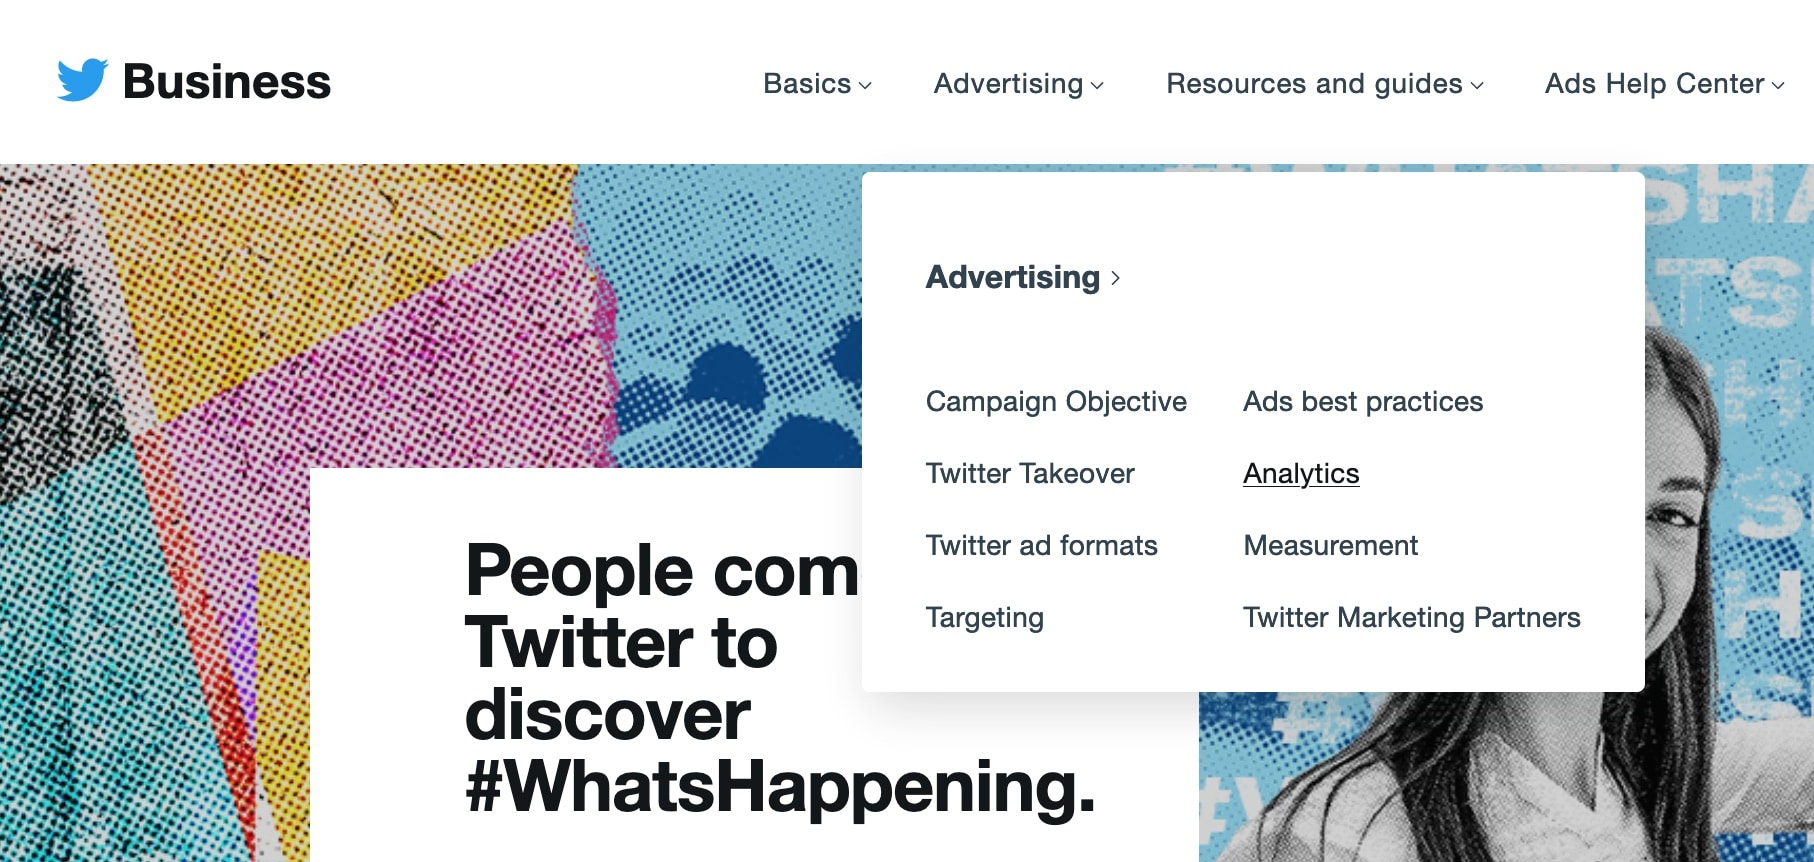
Then, scroll all the way down to the bottom and click on Visit yours now under the Business Insights Dashboard header.
Et voilà! Some moderately helpful Twitter insights, like so:
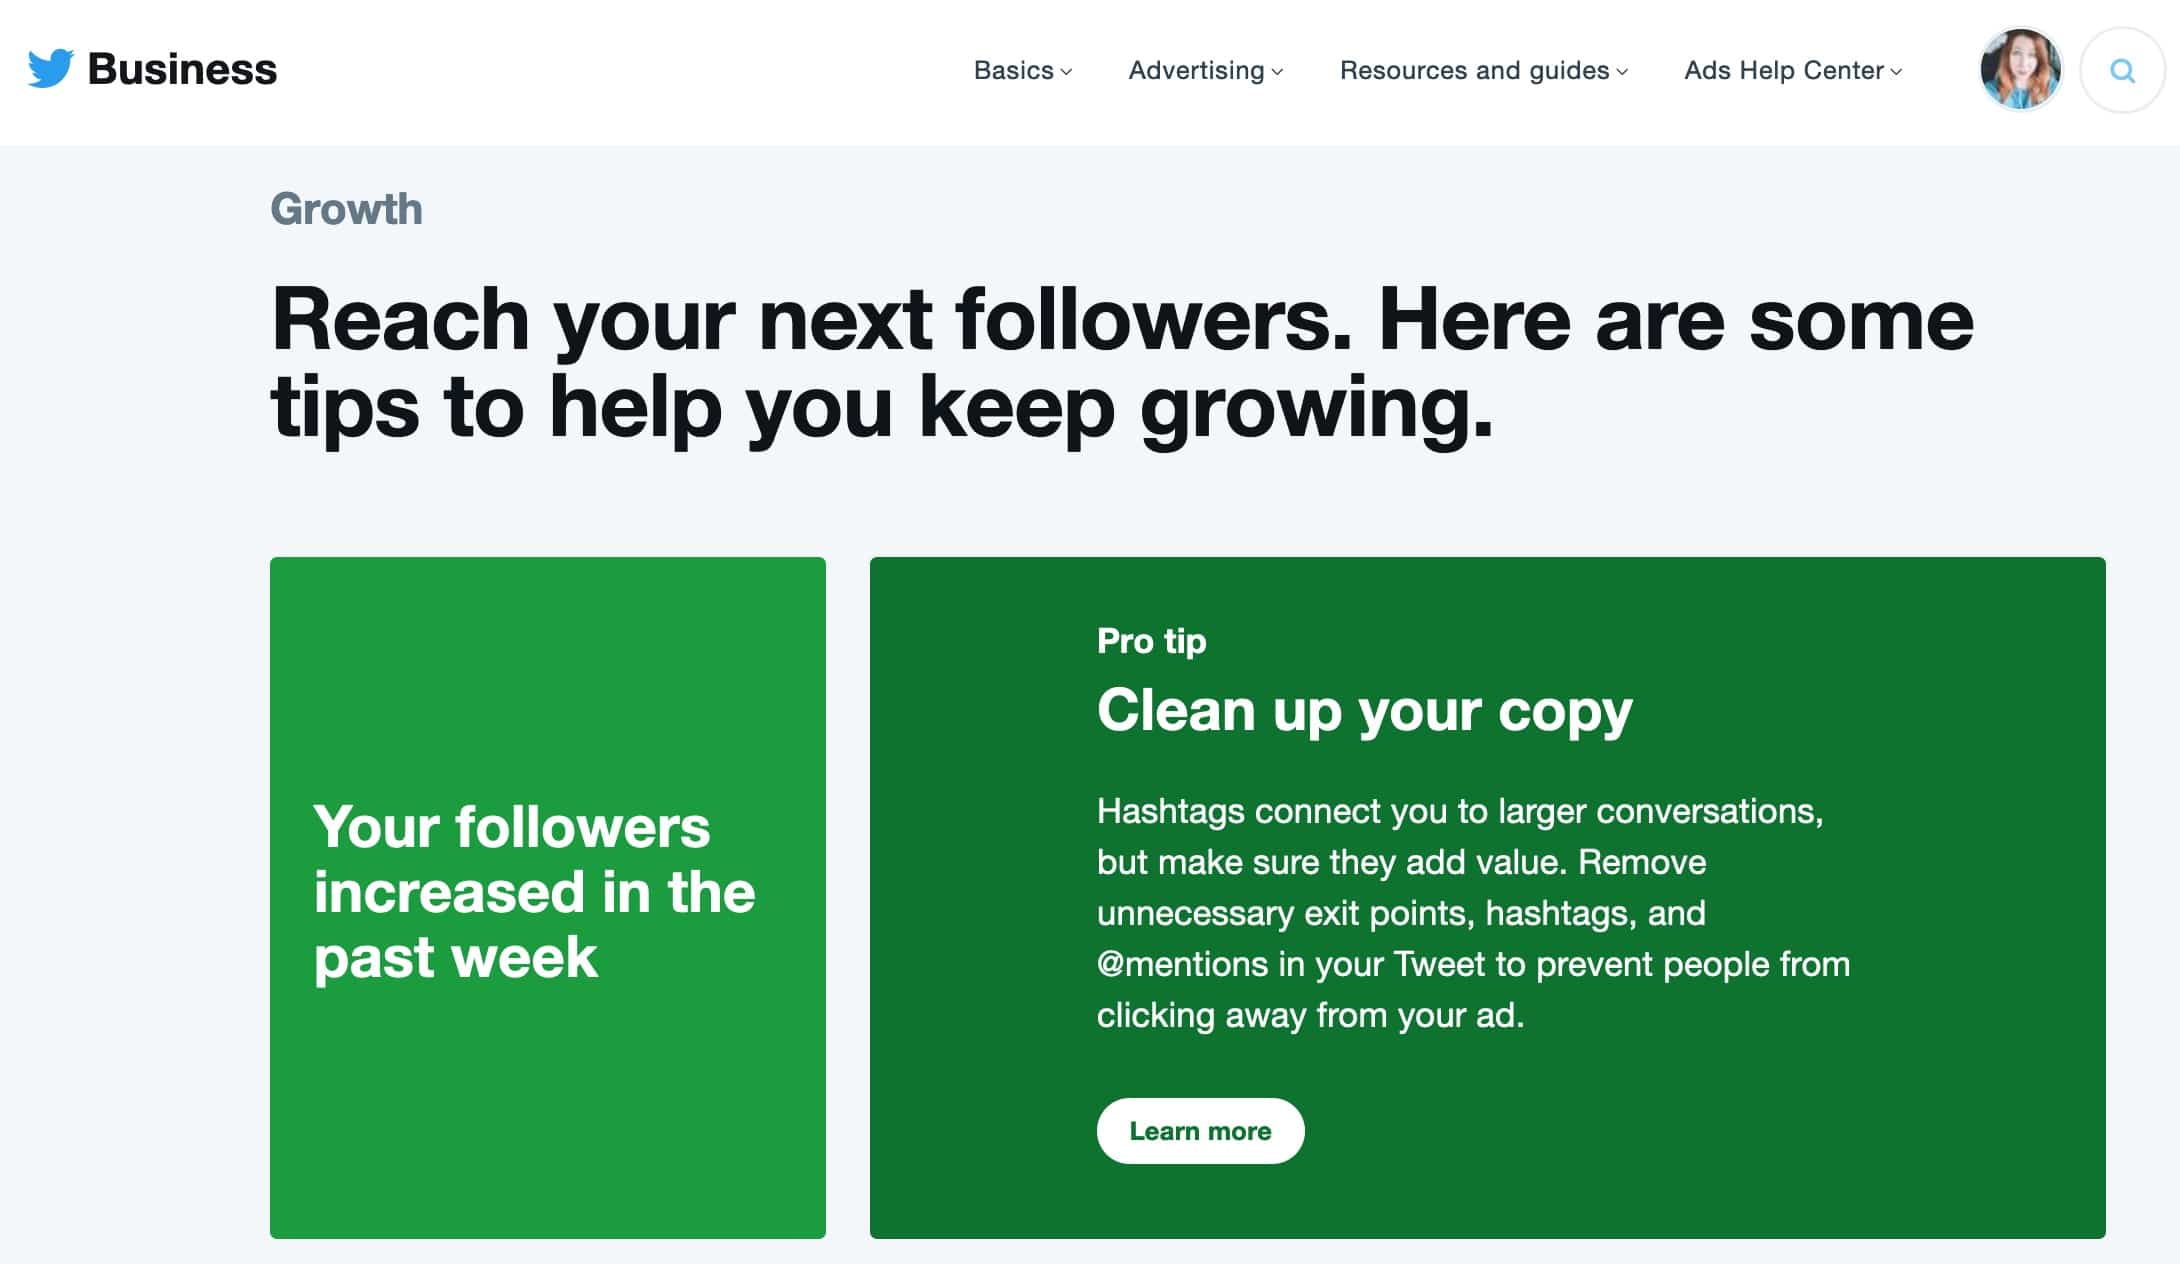
Clean up my copy. Why I oughta… Do you even know who I am, Twitter?
OK, so now that you know what Twitter analytics can do, here’s how to find it.
How to check your Twitter analytics
How to access Twitter analytics via desktop
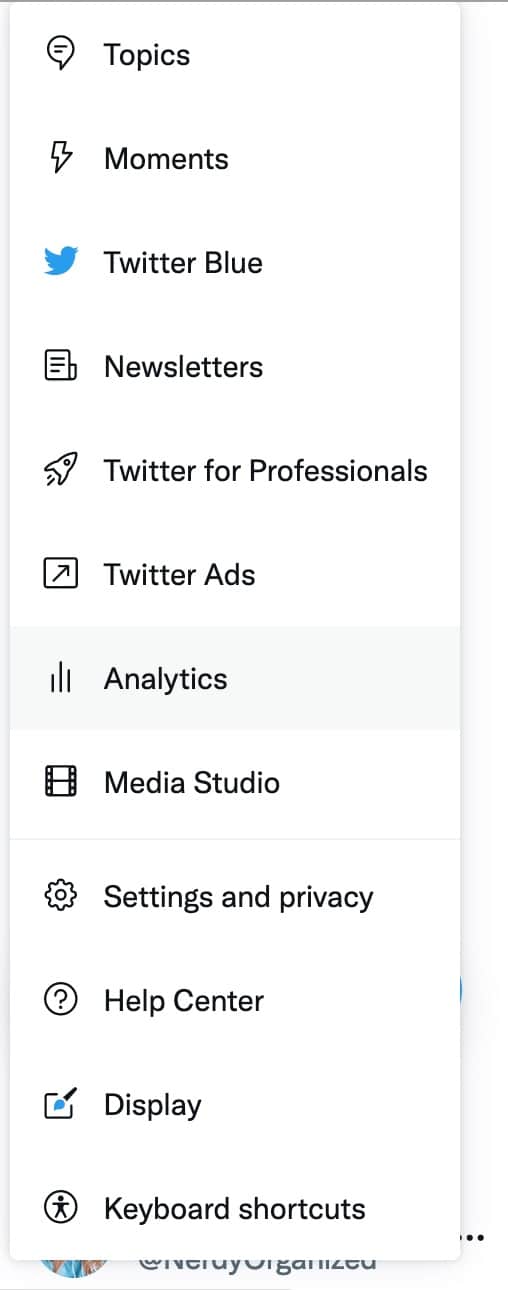
Open Twitter in your browser and click on More, in the left-side menu. You’ll see Analytics as an option about halfway down. This will bring you to your Twitter analytics dashboard page.
How to access Twitter analytics on mobile
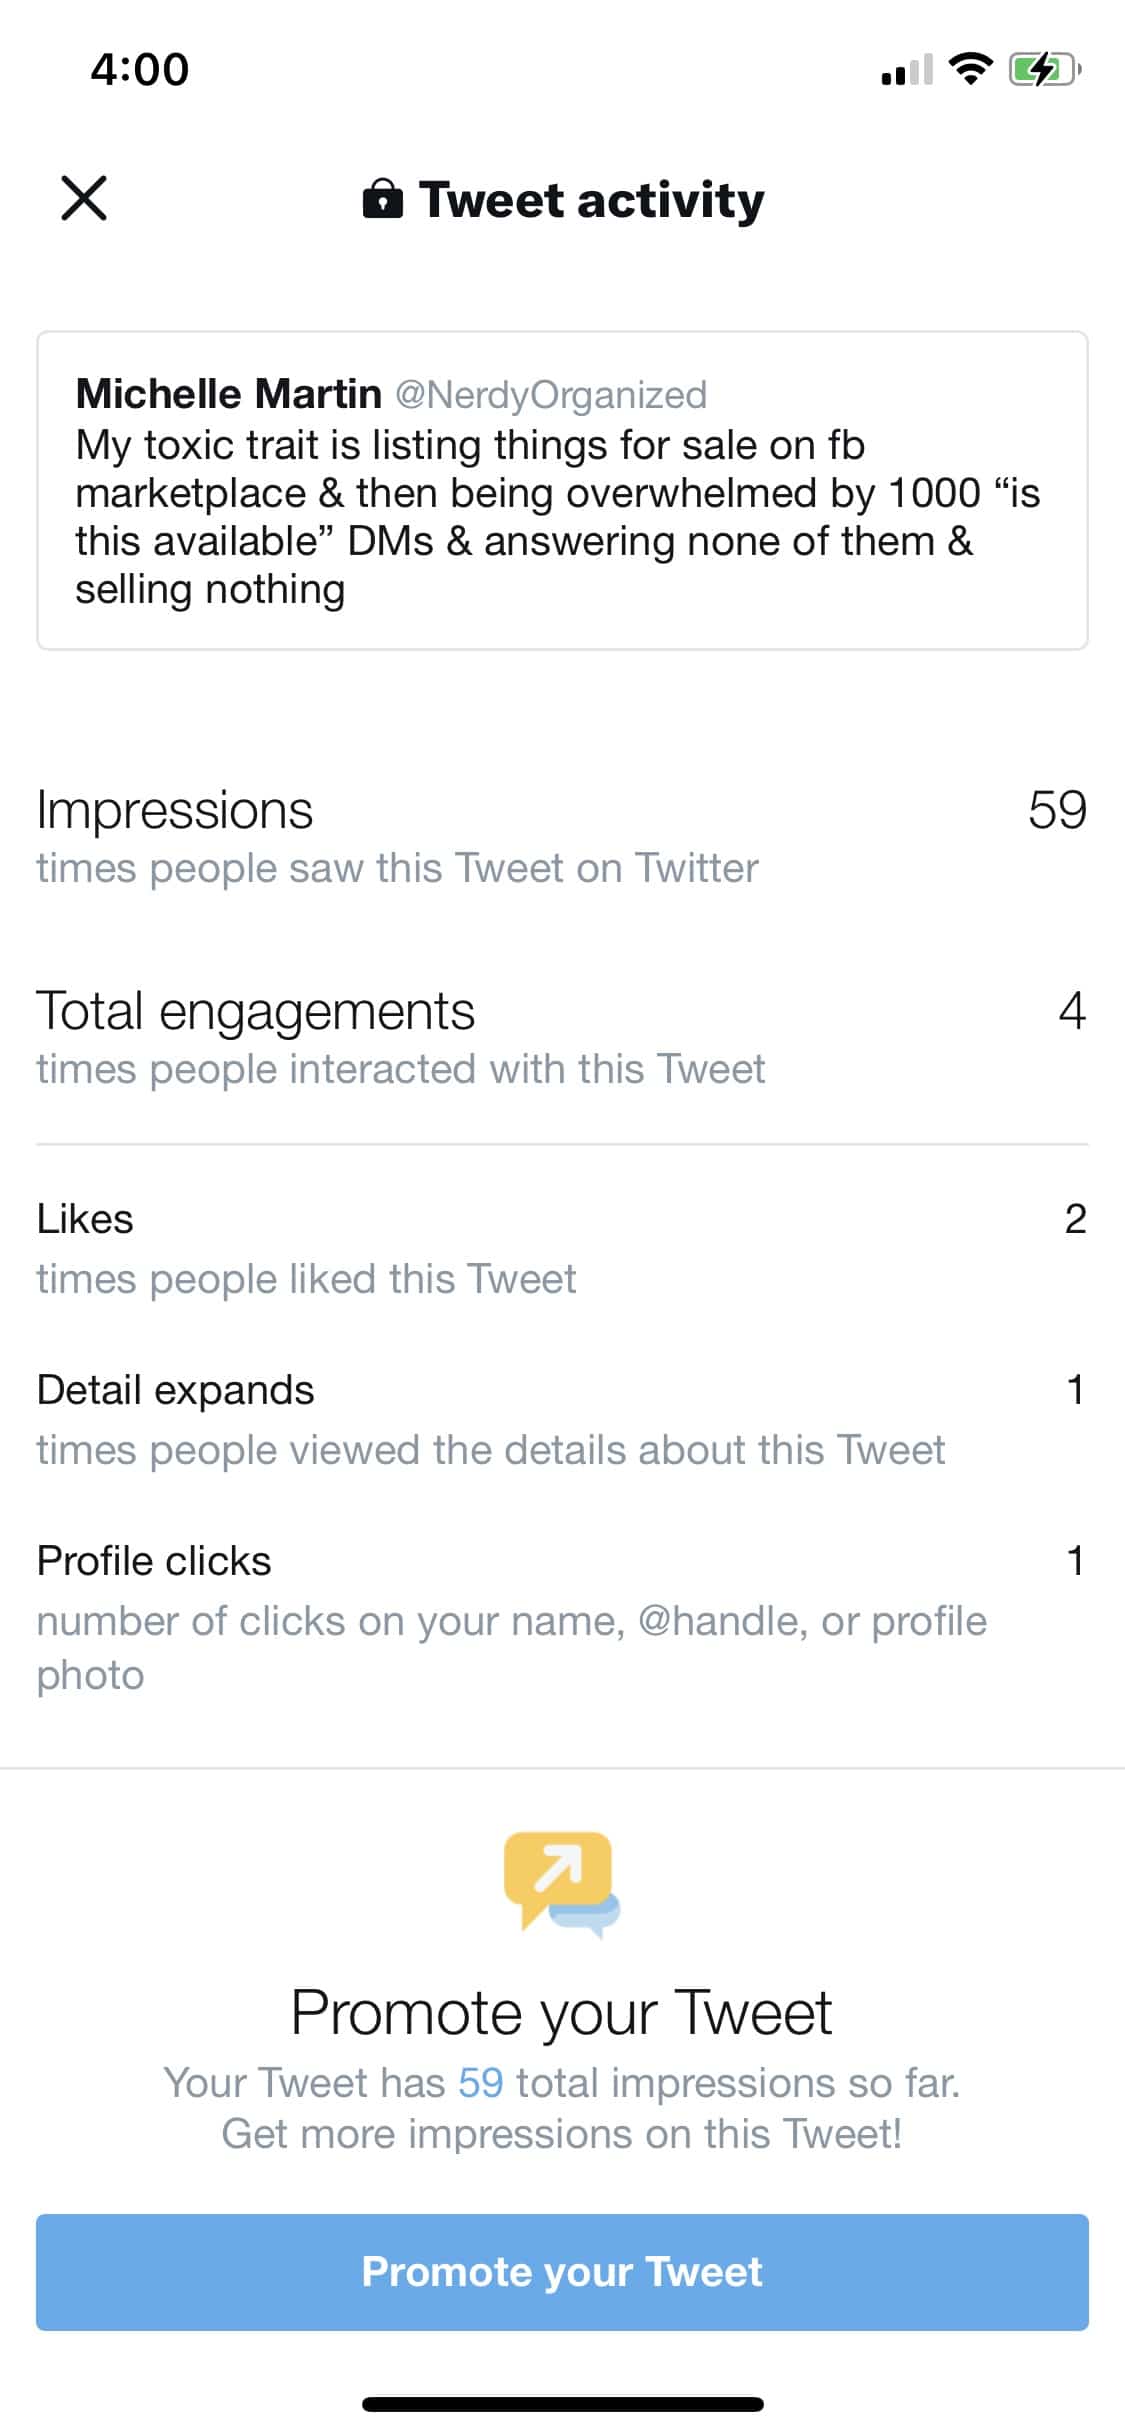
In the mobile Twitter app, you can’t view the full analytics dashboard — but you can see analytics for individual Tweets. Find it by tapping on a Tweet and then tapping View Tweet Activity.
How to access Twitter analytics with Hootsuite
You can view your complete Twitter analytics inside Hootsuite, alongside data from all of your other social platforms. No more hunting around each platform for the metrics you need to track — it’s all right at your fingertips.
You can find Hootsuite Analytics along the left menu in your dashboard, labeled Analytics.
Tracking your Twitter analytics (and analytics for all your platforms!) in Hootsuite allows you to:
- Save a ton of time by having everything you need for all your accounts in one place.
- Create and export custom reports so that you can track the social media metrics most important to your company.
- Set benchmarks and track growth.
- Get insights on the best times to post and your overall campaign ROI.
11 Twitter metrics to track for the best results
Some of these will be more important to you than others, but generally speaking, these are the 11 Twitter analytics metrics you should care about.
Twitter hashtag analytics
Impressions
What it is: The number of views your Tweet received.
Why it matters: It tells you how many eyeballs are on your content. This, combined with your engagements, is what gives you an engagement rate for each Tweet and your overall account. Impressions tell you if people find your content compelling.
Sometimes, getting high impressions can simply be due to the hashtag(s) you use, so play around with different ones to find what works best.
Top Tweet
What it is: This is in the Home tab of your Twitter analytics dashboard. Twitter will show your most popular Tweet for each month (or other date range selected). You can also find your Tweets listed with their engagement rate on the Tweets page.
Why it matters: This is what your audience is responding to the most. Give them more of that.

Twitter followers analytics
Follower gain/loss
What it is: The number of followers you gained or lost over a specific time period. This is available in both the Dashboard and Tweets pages.
Why it matters: This is often the top Twitter metric to track, or near the top, for most businesses. It’s one of your main signals of growth alongside your engagement metrics.
Top followers
What it is: The person with the most followers who recently followed you. You can find this on your Dashboard page.
Why it matters: What if The Biebs follows you and you didn’t know? But seriously, this is a quick and easy way to keep track of the movers and shakers you’re connected to.
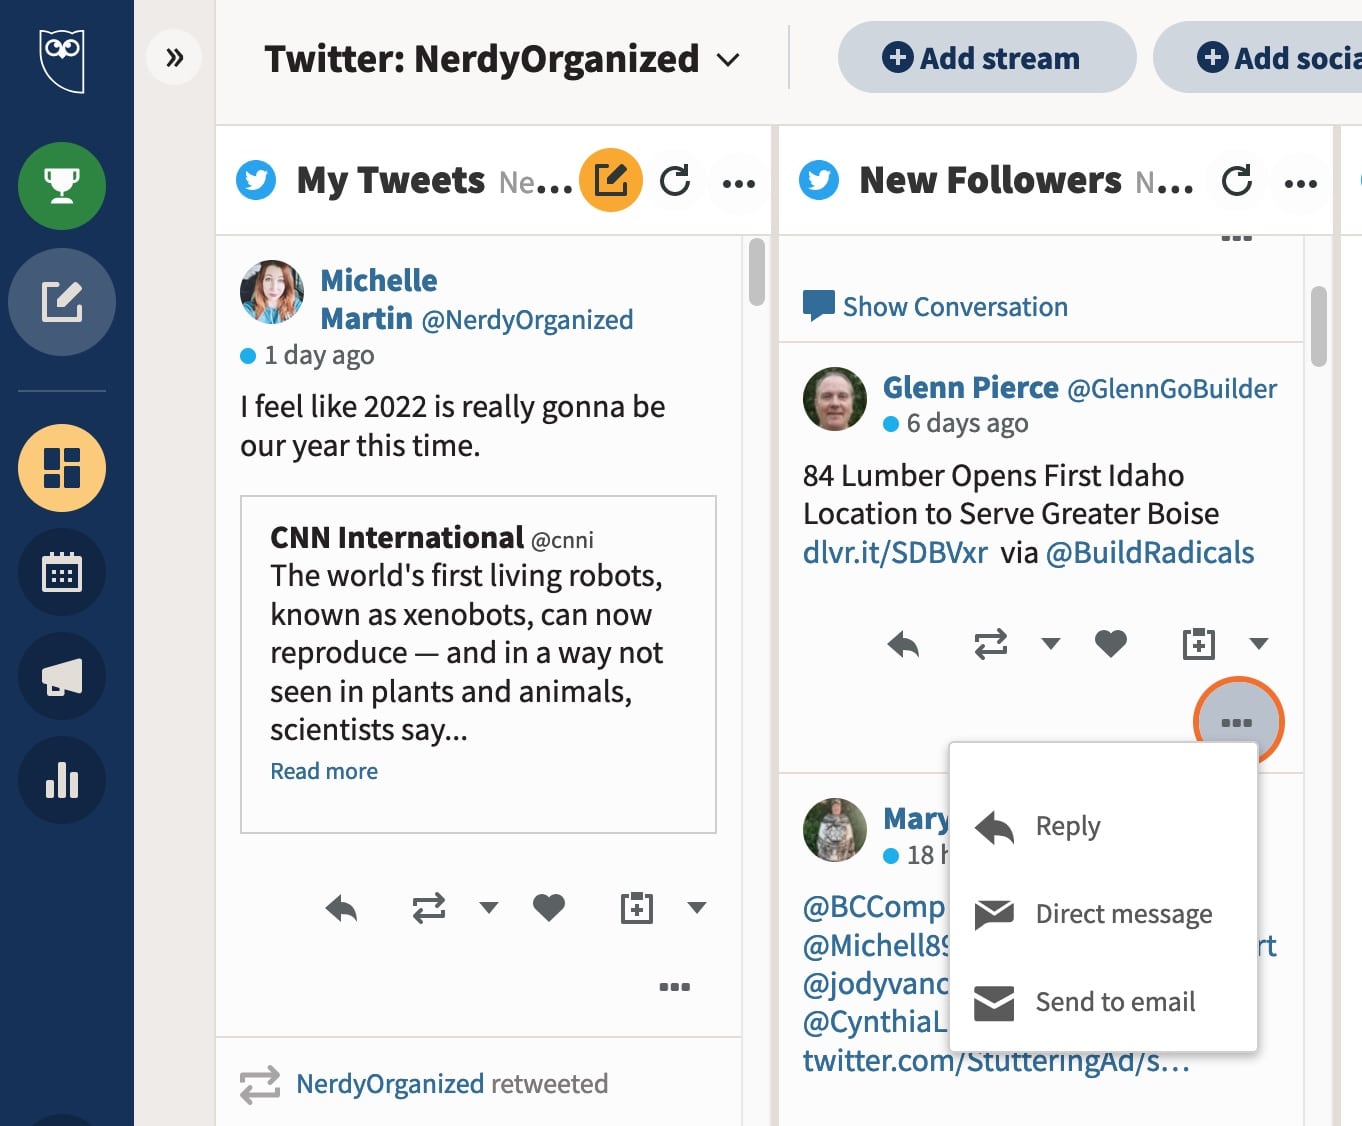
New followers
What it is: The fresh new faces who have recently followed you.
Why it matters: Reaching out quickly after someone follows you increases the likelihood of a productive interaction, since you’re still top of mind.
In Hootsuite, you can see a list of Tweets from all your recent followers. You can reply to their Tweet, send a direct message or email yourself a link to their Tweet to follow up on later.
Top mention
What it is: The Tweet with the most engagements that mentions you (@yourname) for the selected time period. You can find this on the main Dashboard page.
Why it matters: Whether it’s a customer talking about you or a media mention, this is bound to be a popular Tweet. You’ll already have responded to it by the time it shows up on your monthly summary. But, seeing your previous popular mentions can help identify patterns of what people are saying about you.
Twitter engagement analytics
Engagements
What it is: The big juice! Engagements are all the interactions people have had with your Tweet. That includes:
- Link clicks
- Hashtag clicks
- Expanding to view the full Tweet
- Clicking your Twitter profile photo or username
- Retweets
- Replies
- Follows
- Likes
So, just about everything then.
Why it matters: The reason all of these are part of engagements is to determine the overall engagement rate of your Tweets. You can view detailed statistics for each of the above-mentioned Twitter analytics, too.
Having a high-level overview of your engagements lets you quickly determine which tweets are working for you and which aren’t.
Engagement rate
What it is: Here’s some math for ya: (Engagements ÷ Impressions) = Engagement rate. On the Tweets page, you can see the engagement rate of each Tweet as well as your average rate.
Why it matters: Your engagement rate is a good indicator of overall performance. After all, if a Tweet lands in the forest, but there’s no one around to retweet it, did you ever really tweet at all?
Not really. Because if no one is interacting with your Tweets, you’re wasting your time. Setting a benchmark for your engagement rate and tracking it over time will help guide your social media strategy.
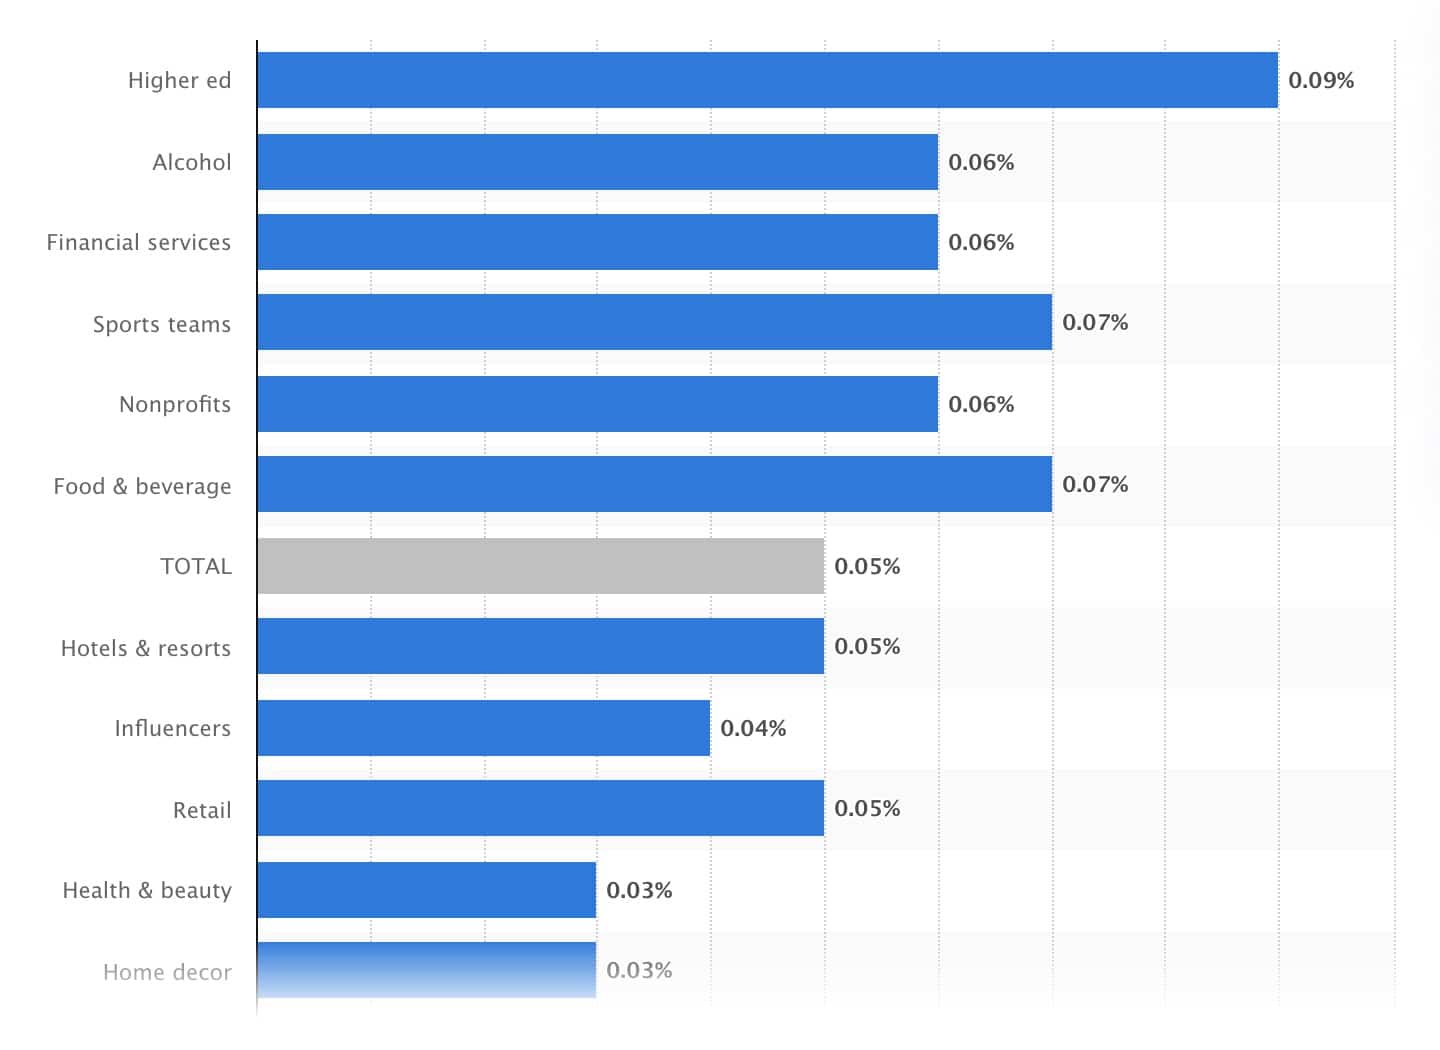
What’s a good Twitter engagement rate? The overall average is around 0.5%, and none of the industries ranked by Statista cracked over 1%.
If you can reach 1.1%… hooboy, you’d be somethin’ special.
Link clicks
What it is: On the Tweets page, you can see link clicks as a total number for the time period. You can also view how many clicks a specific link got by viewing the detailed statistics for that Tweet.
Why it matters: Clicking a link in your Tweet shows a high level of interest in your content or products. It’s helpful to measure the loyalty of your audience.
However, you may want to rethink including links in your Tweets at all. A recent Hootsuite experiment found that linkless Tweets received higher engagement and reach.
In the experiment, only 12% of Tweets were linkless, but 56% of Tweets with the highest engagement were linkless.
I’ve been testing different types of tweets to see how they perform (in terms of engagement) from the @hootsuite channel.
Our most successful posts BY FAR have been linkless posts. No CTAs, no websites, nothing. Just sharing thoughts or helpful information as plain text.
— Nick Martin ? (@AtNickMartin) December 4, 2020
Replies/Retweets
What it is: A reply is a direct response to one of your Tweets, whereas a retweet is like a “share” on other platforms — it’s a reply to you, but it also posts to the other person’s feed.
You can view these Twitter metrics on the Tweets page.
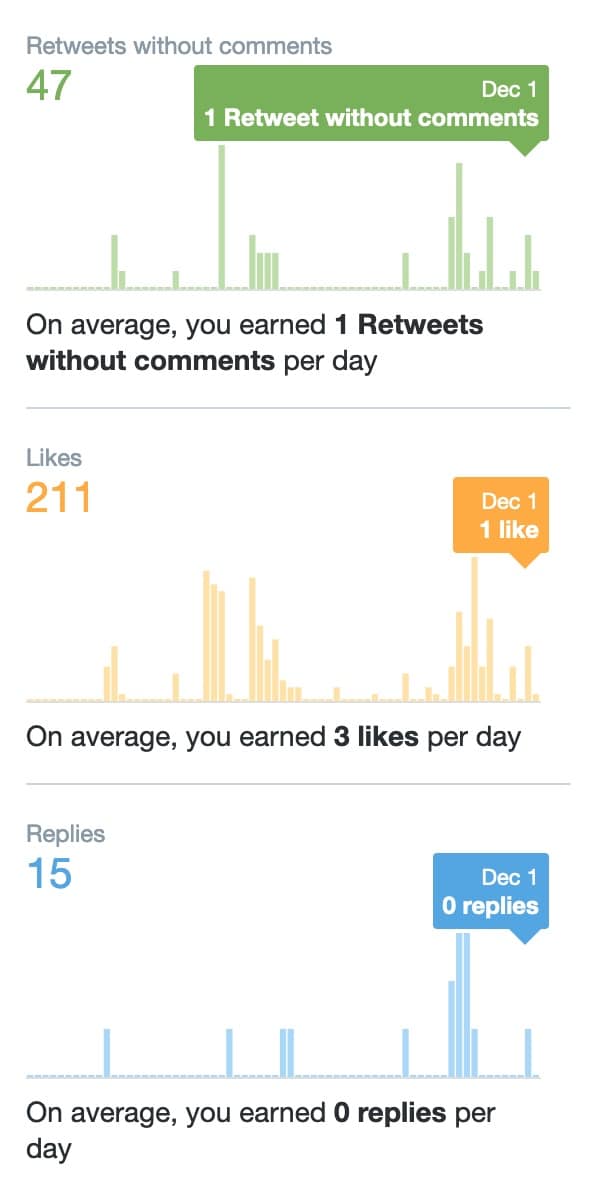
Why it matters: Replies and retweets are the best way to build authentic relationships with your audience. When someone replies or retweets your content, nurture the conversation by replying back.
Likes
What it is: The number of people who liked your Tweets. Likes are also included in Engagements. You can find them on the Tweets page in the right sidebar.
Why it matters: While it takes much less effort to hit a little heart symbol on a Tweet than to reply to or retweet it, it’s still an engagement. It means someone read it and liked it enough to… like it.
You don’t need to track likes as meticulously as your overall engagement rate, but it’s still a good indicator of how your audience perceives your content.
4 must-have Twitter analytics tools
These are Twitter analytics-specific tools, but we’ve also got a list of the best overall Twitter tools to grow your account.
Hootsuite Analytics
Hootsuite’s advantage in analytics is bringing together the results of all your social platforms in one place. With custom reports, advanced metric tracking and the ability to auto-schedule analytics report delivery, you can manage your Twitter analytics on autopilot.
Seeing your Twitter analytics alongside your other platforms allows you to keep the bigger picture in mind as you evaluate your social media strategy.
Check out everything Hootsuite Analytics can do in 2 minutes:
Tweetview
You can create custom searches to track keywords or hashtags on Twitter. A unique feature of Tweetview is the ability to filter mentions by location to pinpoint your audience research and engagement tactics.
BrandMaxima
Analyze your Twitter hashtag performance, find new hashtag ideas and get actionable insights for your Twitter campaigns. It can also report on geographic and demographic trends.
Tweepsmap
Tweepsmap is a follower research tool that allows you to view what your audience is talking about on Twitter, segmented by location and interests. You can also research topics to see where they are most popular around the world.
Whether you’re brand new to Twitter or have been at it for years, don’t be afraid to get down n’ nerdy with your Twitter analytics reports. Numbers don’t lie. They’ll tell you if your current social media marketing strategy needs an adjustment.
After all, nerds run the world.
Effortlessly schedule Tweets, respond to retweets and get valuable Twitter insights to skyrocket your social media growth strategy — across all your platforms. Try Hootsuite for free today.
Easily manage all your social media in one place and save time with Hootsuite.