SE Ranking updates: July 2020
It seems like it was only yesterday that our platform got a new and even more user-friendly look, but with July passing us by in the blink of an eye, it’s time to share yet another batch of updates with you.
This month, we’ve been working on upgrading the Rankings and Analytics & traffic modules. The first one now comes with a new metric and the latter offers new ways of analyzing graphs with traffic and GSC data. Then, there’s a small but important improvement for those of you who work with reports—you can now edit manual reports you created earlier.
Finally, based on your feedback, the new interface now gives you the option to view data on your rankings in every search engine at once. Thank you for sharing your impressions and requests with us. They help us get better and turn SE Ranking into the product that works exactly the way you need it to.
New metric and improved UX of the Rankings module
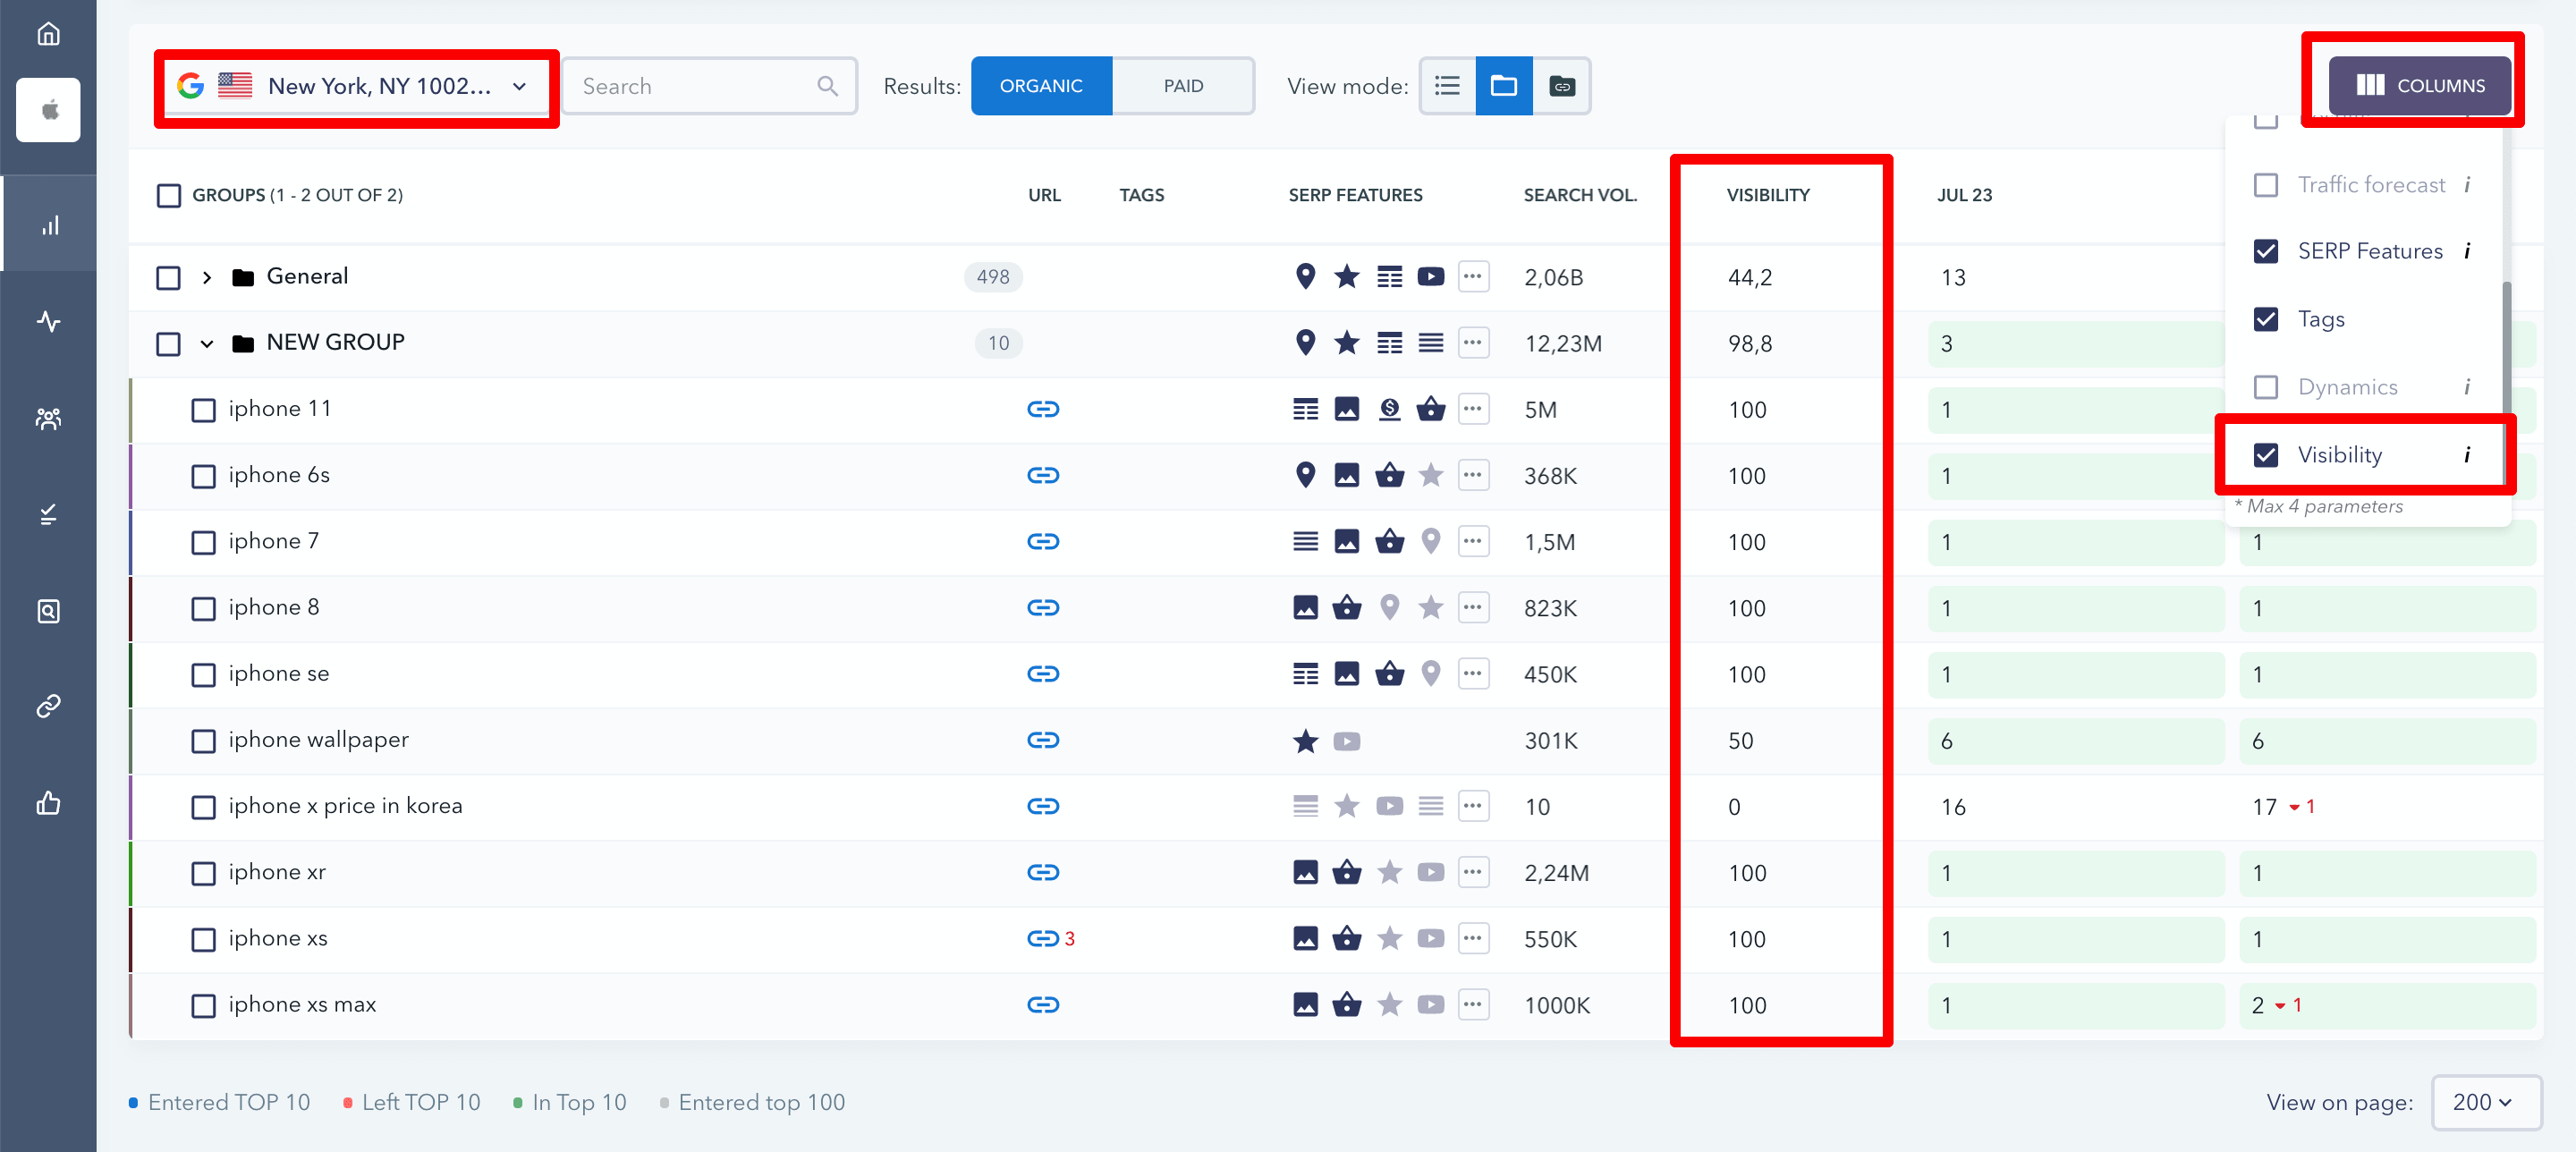
For a while, SE Ranking users have been able to track their websites’ visibility in order to assess how well their SEO efforts are paying off. From now on, you can additionally monitor the visibility of separate keywords and keyword groups. This means you can quickly get numbers on the share of impressions your website gets in organic search results for any given search query. And if you group your keywords by pages that rank for these keywords, you’ll be able to also track the visibility of your website pages.
You can add the keyword visibility metric to the rankings table by checking it in the Columns settings. The values are shown for the search engine you’ve selected.

To learn how exactly we calculate keyword visibility at SE Ranking, check out this blog post. And now let’s move on to the UX.
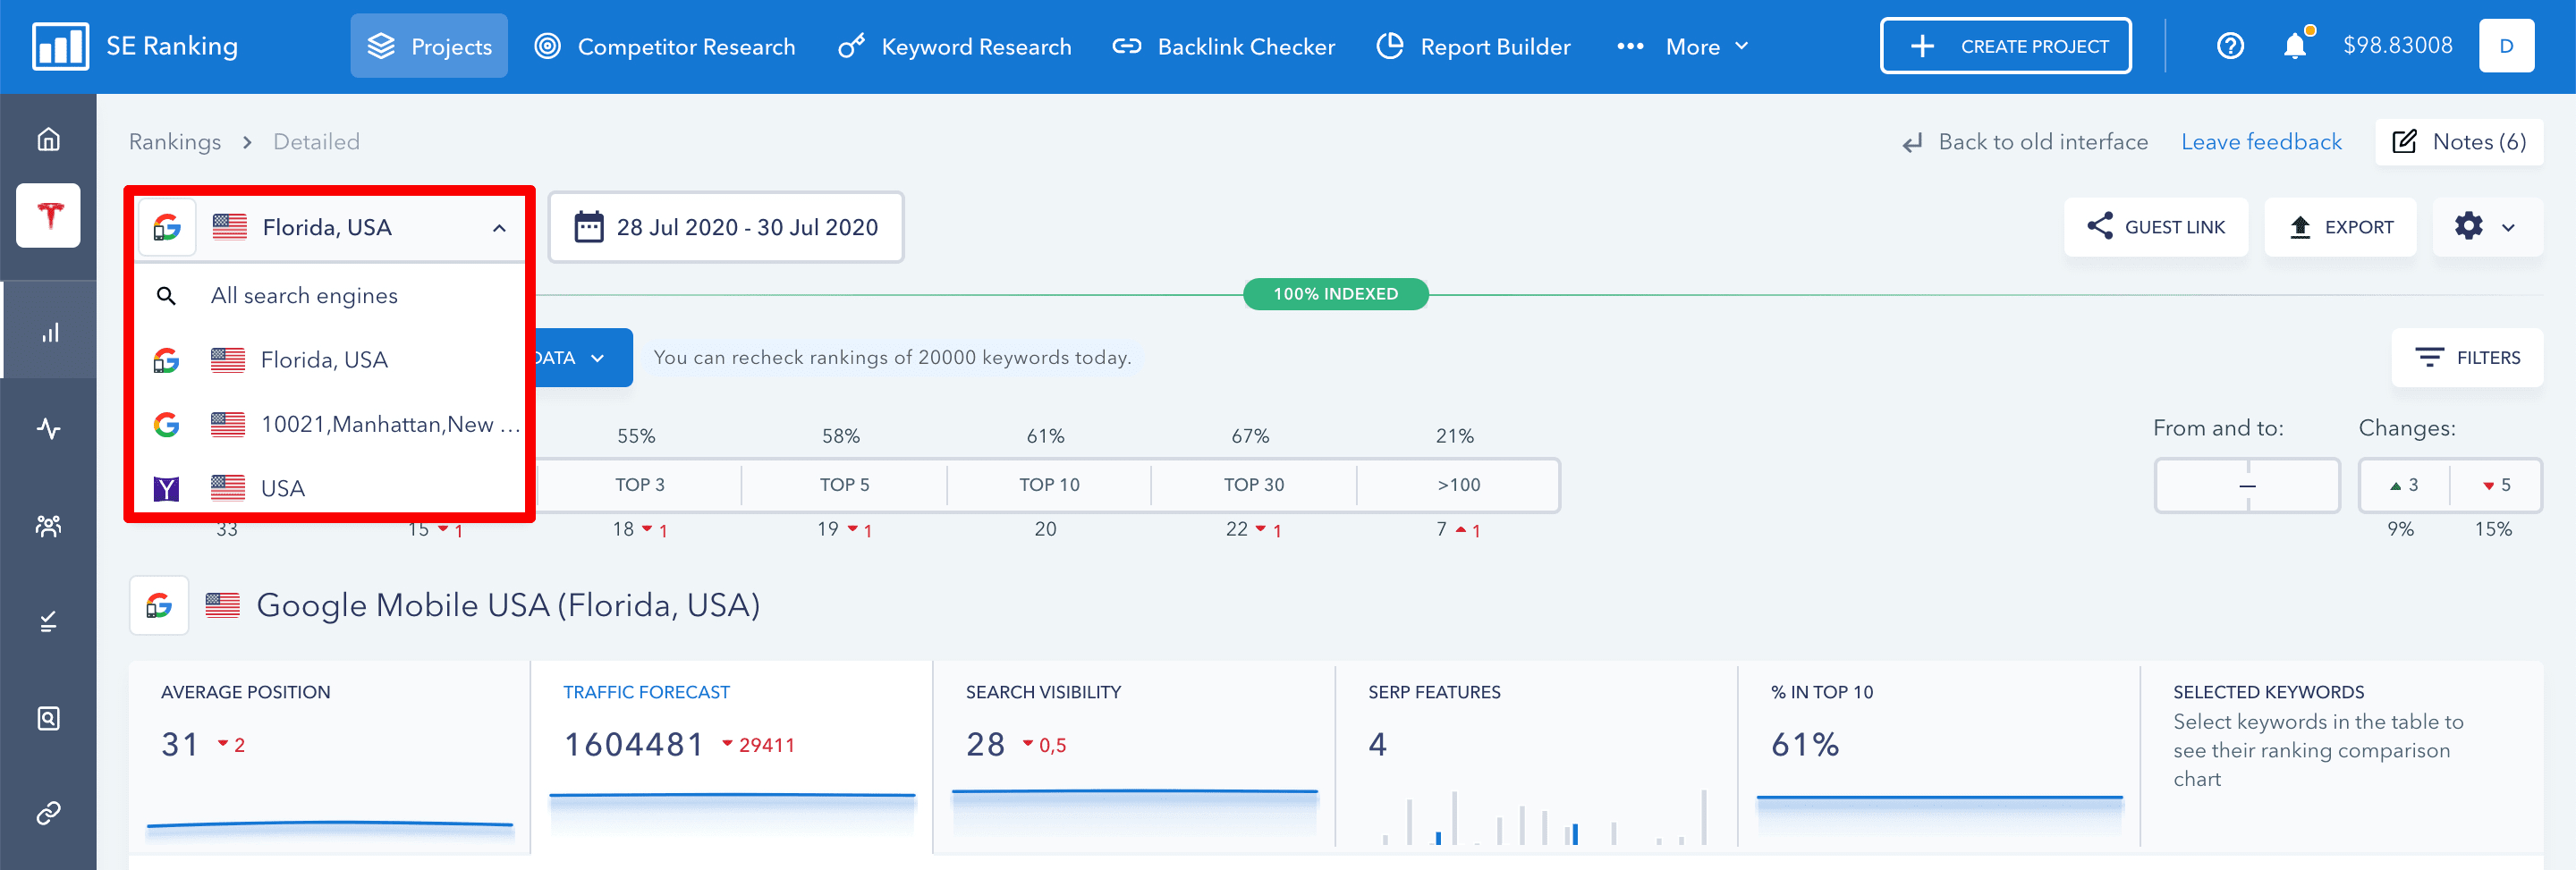
As you surely remember, in the old interface all the graphs and ranking tables with data on different search engines were placed on a single page one by one. You had to scroll through the lists of keywords and graphs to find the necessary data. In the new design, we decided to enable you to pick the exact search engine you need from the drop-down list. However, it turned out that many of you found it more convenient to see the whole bulk of data on a single page.
We’ve taken your feedback into account, and now you are free to choose the way you want to have rankings data presented on your screen. From the drop-down menu, you can either pick one of the search engines you are interested in or go for the All search engines option. In the latter case, you’ll see your rankings data for all the search engines you track on one page, just like in the old interface.

New opportunities for analyzing bulks of data
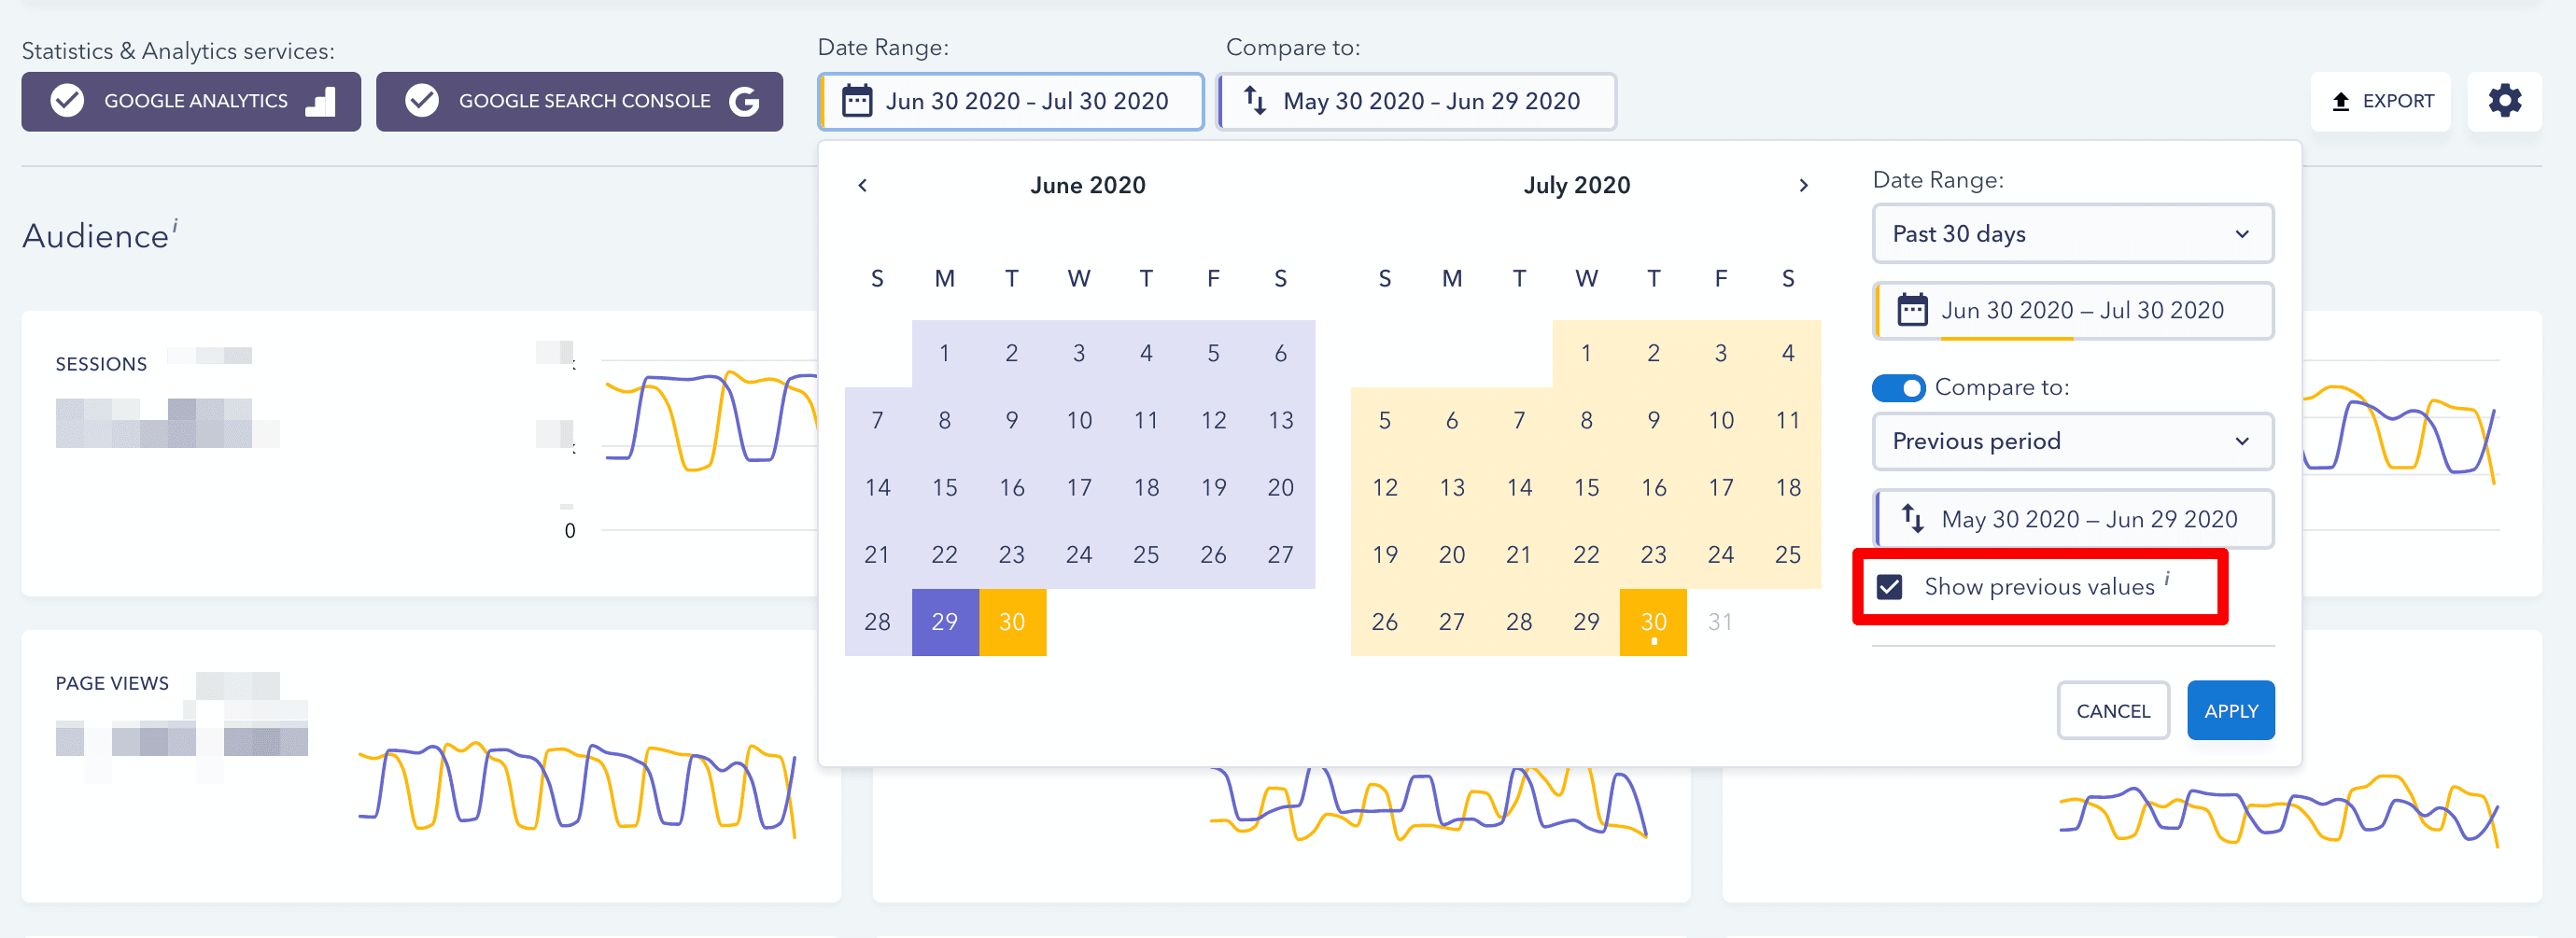
Over the past few months, we’ve revamped every section of the Analytics & traffic module, filling them with new tabs and informative graphs. Now we’ve implemented a feature that will allow you to get even more data from graphs in one click. When setting the time spans for analysis, you can choose the way you want to compare data for the current and previous periods.

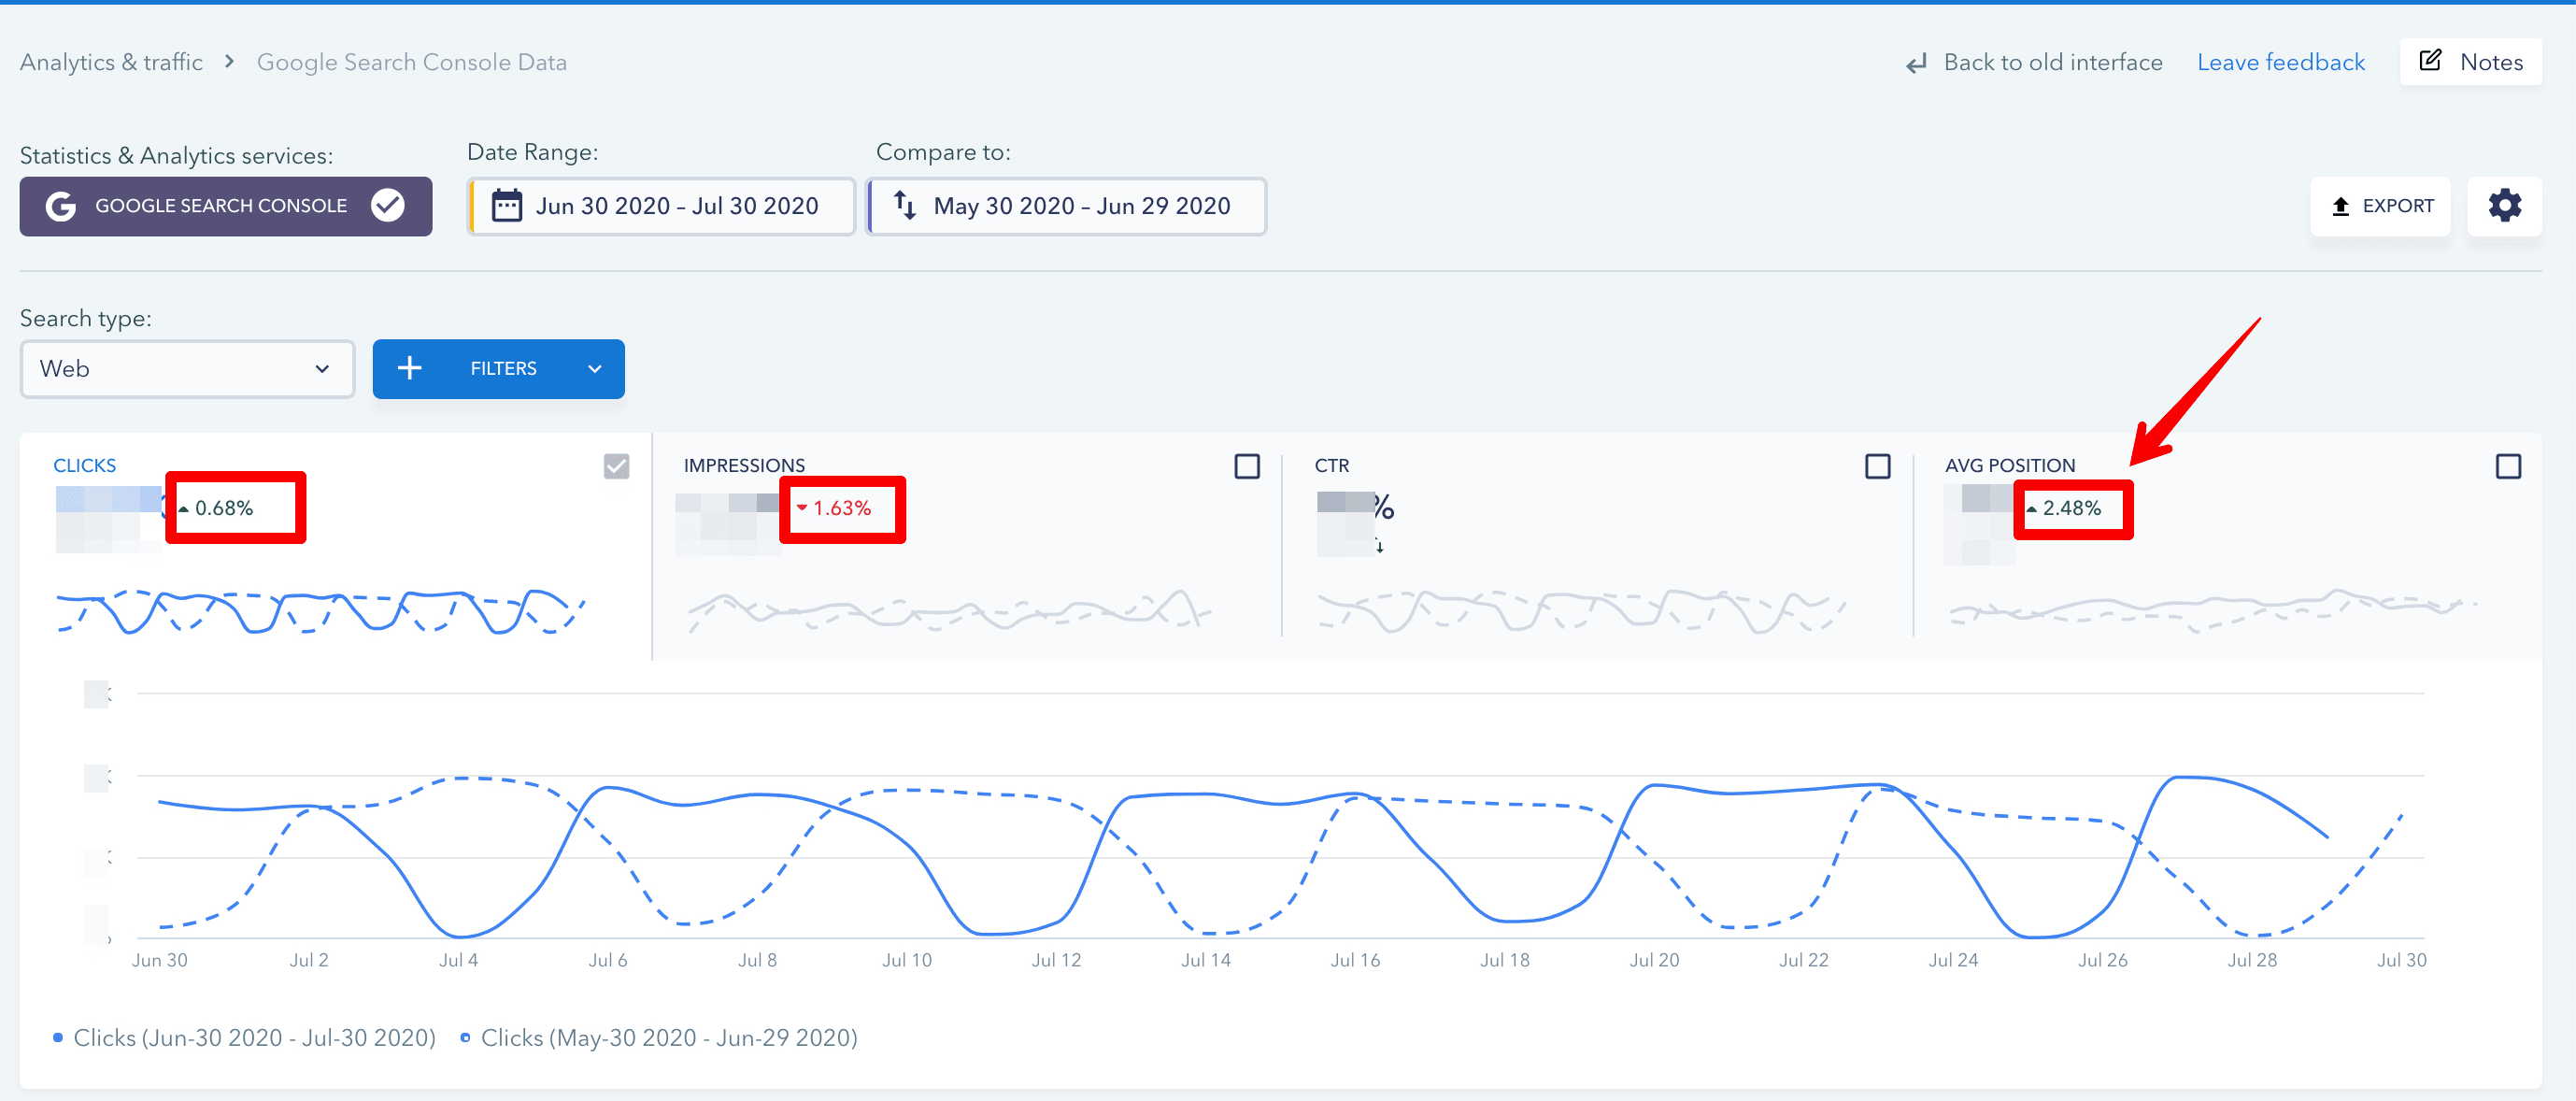
If you tick the Show previous values checkbox, the graphs will show you the difference in performance between the two selected periods in percentage.

When unchecked, the difference will be displayed in numbers. You can also remove data for the previous period from the graphs. To do so, simply drag the slider.
The feature has been implemented in every section of the Analytics&traffic module that allows you to compare current data to the previous period, namely Overview, Traffic, and Google Search Console Data.
Editing reports you created earlier
To improve your reporting, we’ve implemented an option to edit the manual reports you created earlier. Besides, we’ve added an option to start editing any of the reports by clicking its name.
To edit any of the reports, go to the Report Builder, pick the section you need—be it Manual, Scheduled, or Pre-Structured Templates—and click the report name or hit the editing button that will appear when you hover over the report that you’d like to edit.

That is it for now. With just over 30 days of summer left to go, make sure to use this time to catch some sunshine if it’s warm where you are. In any case, we wish you to have a productive month, and we ourselves will be working hard to present you with a new bunch of updates. We’re developing some really cool features right now, so stay tuned!
Post Views: 1,168
