Social Media KPIs That Top Growth Companies Track
Effective measurement powers smart decisions. In the realm of social media marketing, knowing which key performance indicators (KPIs) to track separates successful growth companies from those struggling to show ROI. The right metrics reveal what’s working, what’s not, and where to focus your resources for maximum impact.
What makes certain companies achieve consistent growth through social media while others see minimal returns? The answer often lies in which metrics they choose to monitor. Top performers focus on KPIs that connect directly to business outcomes, not just vanity metrics.
In this article, I’ll share the essential social media KPIs that high-growth companies prioritize, why they matter, and how to implement them in your strategy. These insights come from years of working with businesses to maximize their social media ROI.

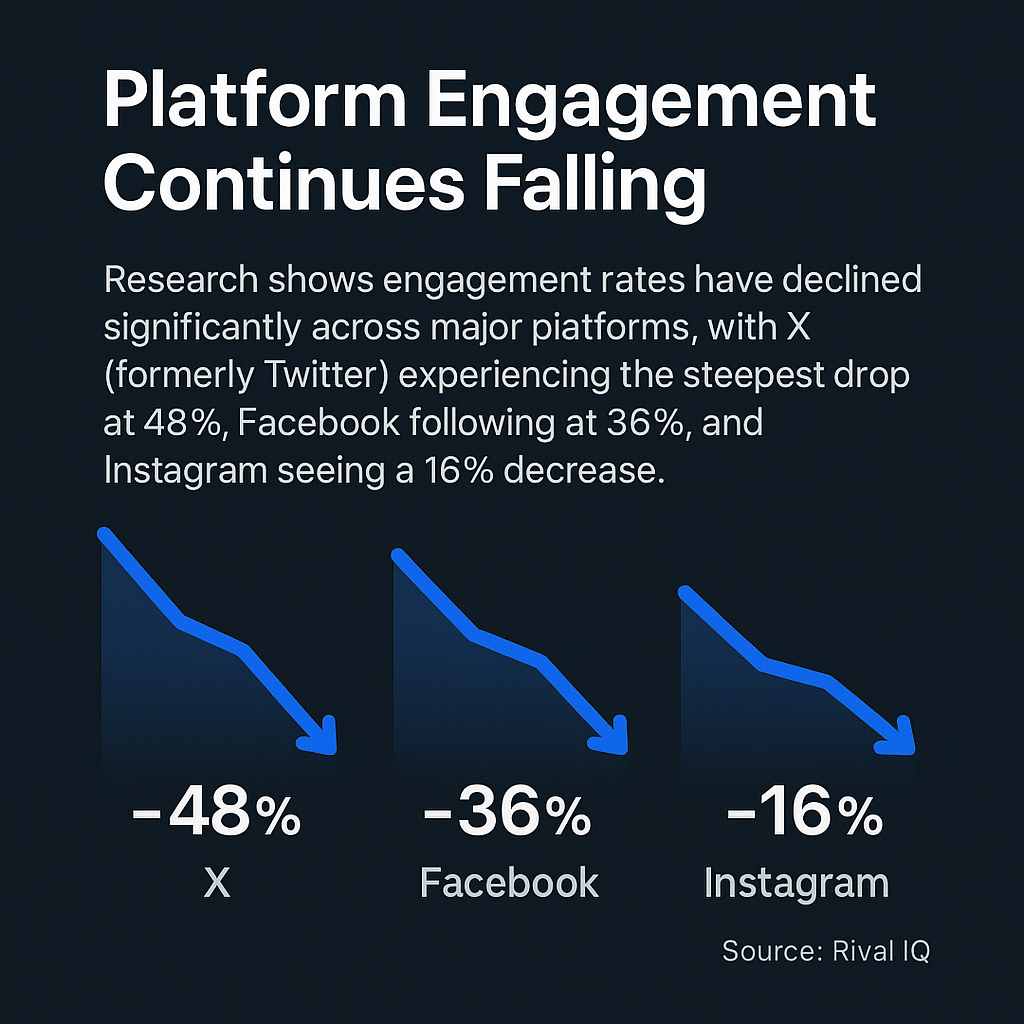
Social media engagement faces challenging headwinds. Research shows engagement rates have declined significantly across major platforms, with X (formerly Twitter) experiencing the steepest drop at 48%, Facebook following at 36%, and Instagram seeing a 16% decrease.
Despite these challenges, social media remains vital for business growth. With 5.45 billion users worldwide (67.1% of the global population) spending an average of 2 hours and 24 minutes daily across approximately 7 platforms each month, the opportunity for brand connection is enormous.
Growth companies understand that what gets measured gets managed. When you track the right KPIs, you create clear connections between social media activities and business results. This clarity enables smarter resource allocation and strategy refinement.
But which metrics truly matter? Let’s focus on the KPIs that directly impact growth rather than vanity metrics that merely look impressive in reports.
Core Engagement KPIs That Drive Business Growth
Engagement metrics form the foundation of social media success. They reveal how effectively your content resonates with your audience and drives them to take action. Let’s examine the three most critical engagement KPIs growth-oriented companies track religiously.
Engagement Rate: The Foundation of Social Performance
Engagement rate measures audience interaction with your content relative to your reach. It’s calculated slightly differently across platforms but generally includes likes, comments, shares, and saves divided by reach or followers.


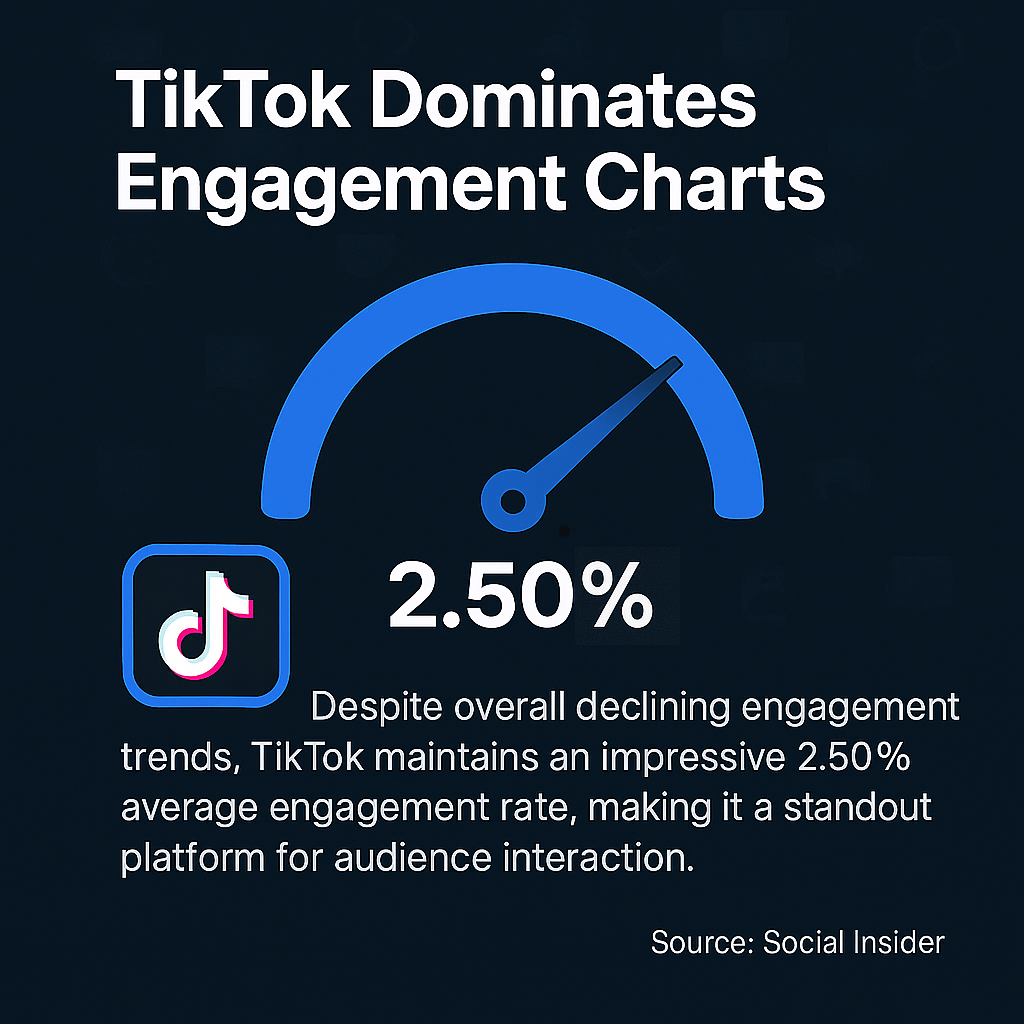
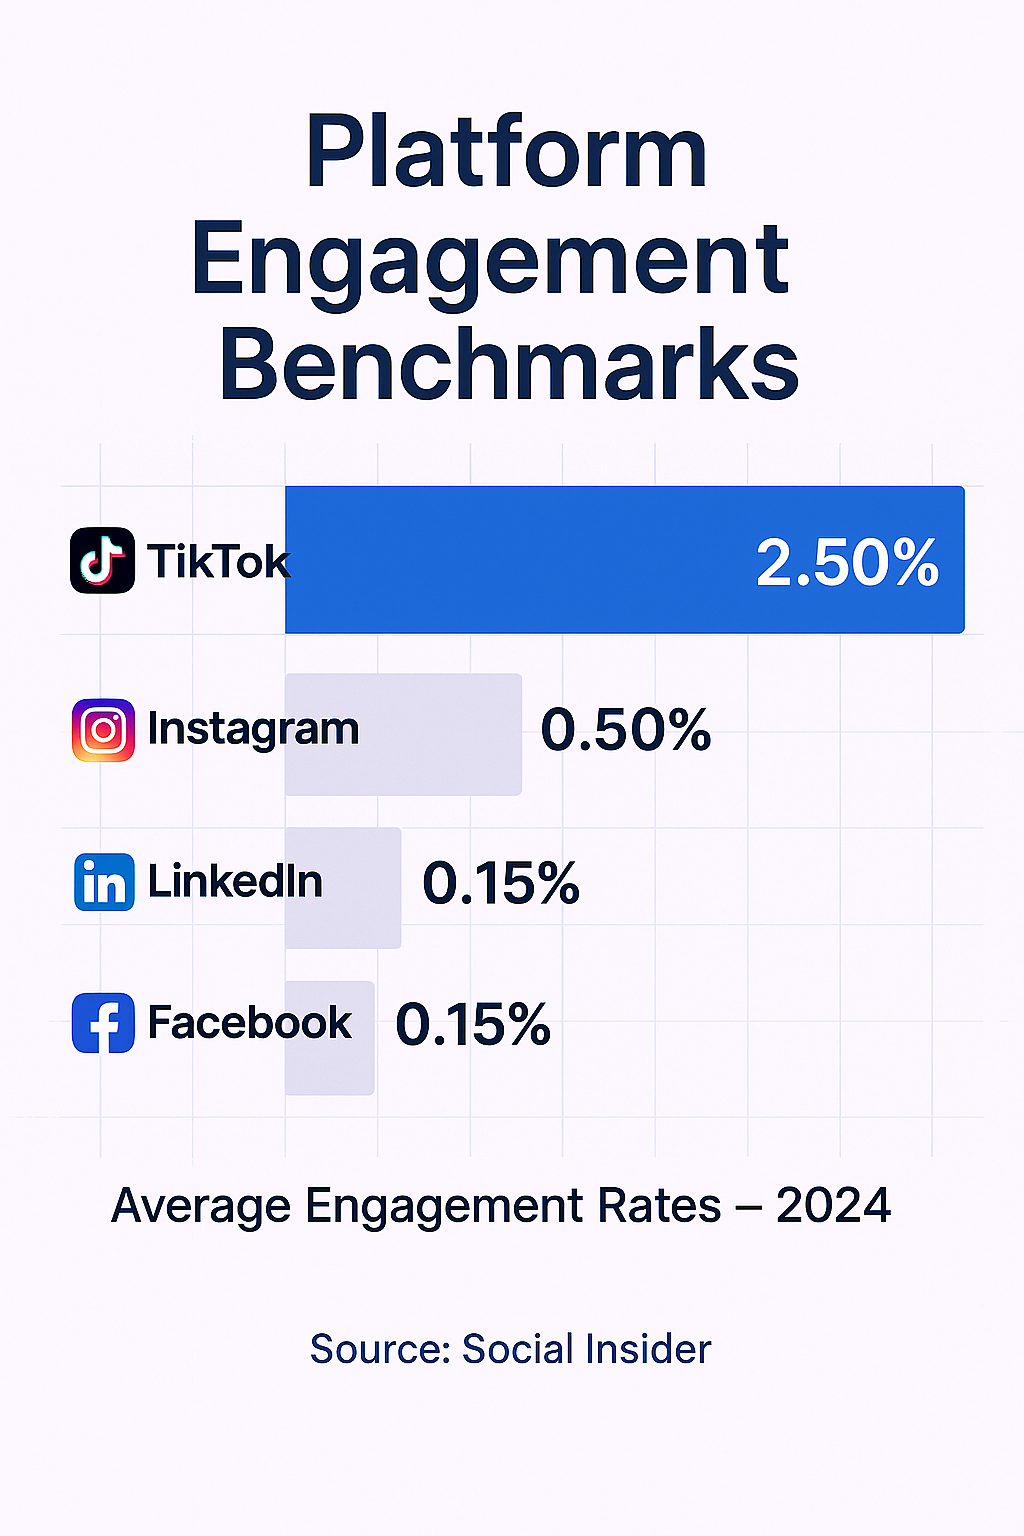
Despite overall declining engagement trends, TikTok maintains an impressive 2.50% average engagement rate, making it a standout platform for audience interaction.
Several factors influence your engagement rates:
- Content relevance – How well your content addresses audience interests and needs
- Posting timing – When your audience is most active and receptive
- Content format – Video, image, text, or interactive elements
- Authenticity – How genuine and non-promotional your content feels
- Call-to-action effectiveness – How clearly you prompt engagement
Growth companies use social media analytics tools to track engagement rates by content type, time period, and audience segment. This granular analysis reveals patterns that inform content strategy.


| Platform | Average Engagement Rate |
|---|---|
| TikTok | 2.50% |
| 0.50% | |
| 0.15% | |
| 0.15% |
The table above shows benchmark engagement rates across major platforms. These numbers provide context for evaluating your performance relative to industry averages.
Conversion Rate: Turning Engagement into Action
While engagement shows interest, conversion rate reveals action. This metric measures the percentage of users who complete a desired action after engaging with your social content. Conversion actions vary by business but often include:
- Email signups
- Content downloads
- Product purchases
- Free trial activations
- Demo requests
Calculating social media conversion rate is straightforward: divide the number of conversions by the total number of visitors from social channels, then multiply by 100. For example, if 500 visitors from Instagram resulted in 25 purchases, your conversion rate is 5%.
What makes social media ROI truly measurable is tracking how engagement translates to these meaningful business outcomes. Top growth companies set up proper UTM parameters and conversion tracking to attribute results accurately to specific platforms and campaigns.
Click-Through Rate (CTR): Measuring Content Effectiveness


Click-through rate measures the percentage of people who click on a link in your social content relative to those who see it. It’s a direct indicator of how compelling your content is and how effectively it drives traffic to your website or landing pages.
A high CTR indicates your content resonates with your audience and creates enough interest to warrant further exploration. A low CTR suggests your content may not align with audience interests or your call-to-action lacks clarity.
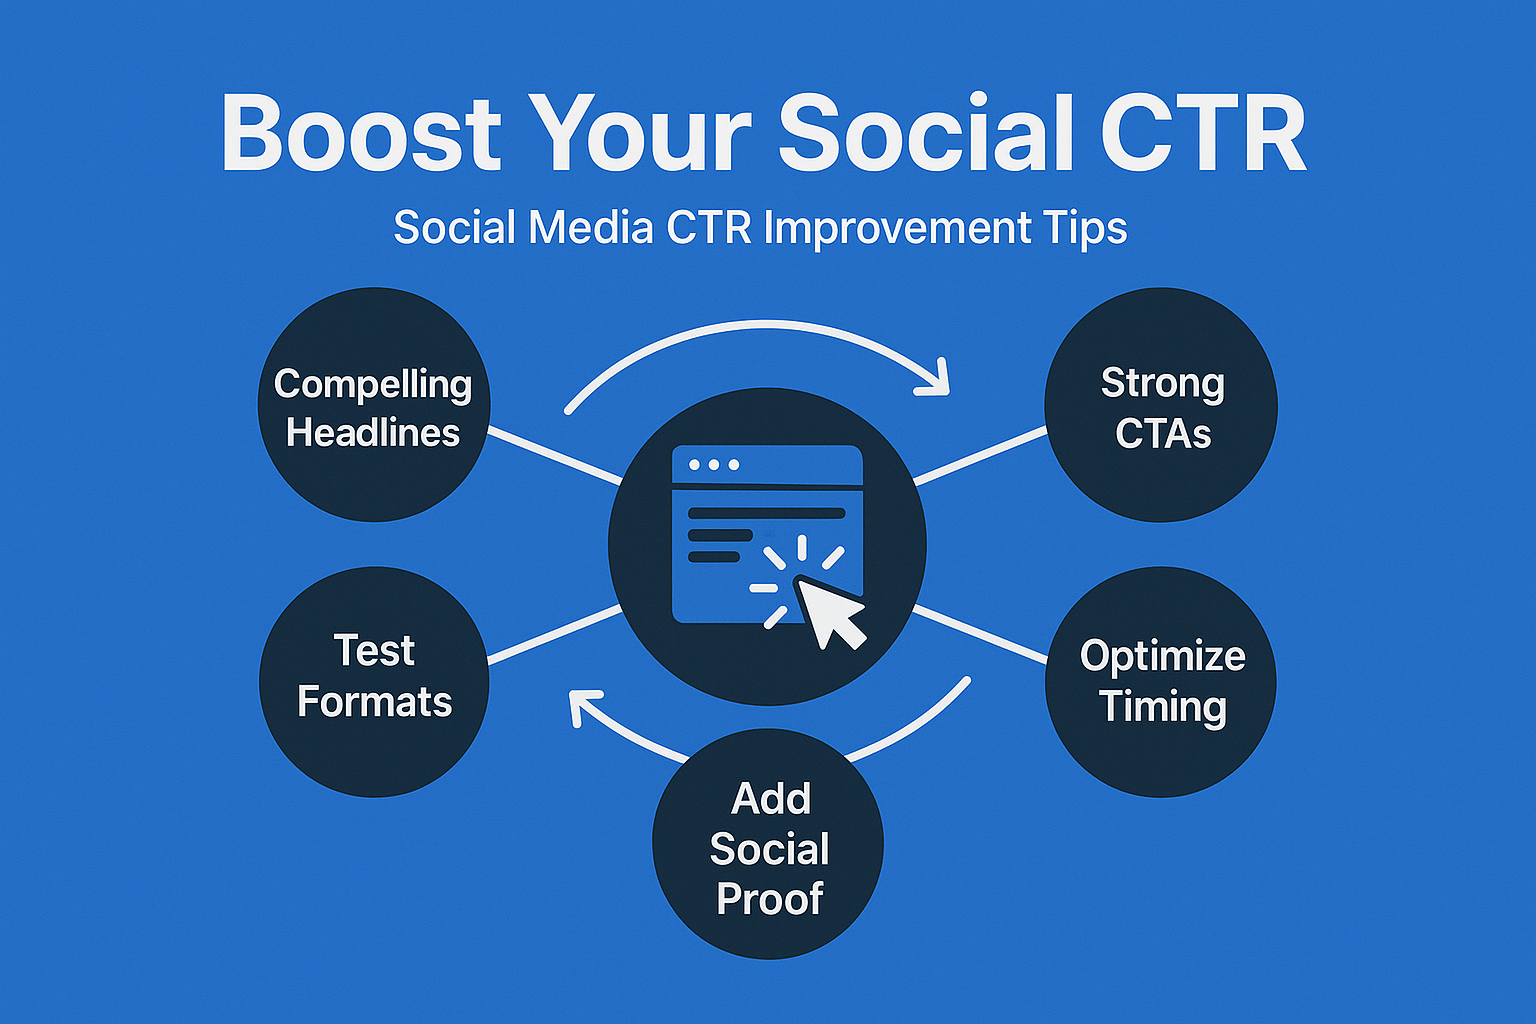
Here are effective ways to improve your social media CTR:
- Create compelling headlines that promise clear value
- Use strong calls-to-action that tell users exactly what to do
- Test different creative formats to see what drives more clicks
- Optimize posting times based on when your audience is most active
- Include social proof to build credibility and trust
High-growth companies regularly conduct social media audits that include detailed CTR analysis, examining CTR by content type, topic, format, and audience segment. This analysis reveals which content elements drive the most effective audience action.
Trying to Keep Up with Digital Marketing?
Just released: my new book to help small businesses, entrepreneurs, and marketers master digital marketing in today’s digital-first world.
Drawing on my Fractional CMO experience, Digital Threads simplifies complex strategies into clear, actionable steps for success.
Transform your business today—grab your copy! Click the cover or button below to buy on Amazon.
Revenue-Focused KPIs Smart Companies Prioritize
Beyond engagement metrics, sophisticated social media programs track KPIs that directly connect to revenue. These metrics reveal the financial impact of your social media efforts and help justify investment in these channels.
Return on Ad Spend (ROAS)
ROAS measures the revenue generated for every dollar spent on social media advertising. It’s calculated by dividing the revenue attributed to your ads by the cost of those ads, then expressing the result as a ratio (e.g., 3:1) or multiple (e.g., 3x).
For example, if you spend $1,000 on Facebook ads and generate $5,000 in sales from those ads, your ROAS is 5:1 or 5x.
What constitutes a “good” ROAS varies by industry, product price point, profit margins, and business maturity. Generally, a ROAS of 4:1 or higher indicates strong performance, while anything below 2:1 may require optimization.
The table above provides industry benchmarks for ROAS on social media (Facebook) advertising. These figures help you contextualize your performance and set appropriate targets based on your specific industry.
Growth companies optimize ROAS by:
- Refining audience targeting to reach high-intent users
- Testing different ad formats and creative approaches
- Improving landing page conversion rates
- Implementing retargeting strategies for abandoned carts or browsing sessions
- Regularly refreshing creative to combat ad fatigue
Customer Acquisition Cost (CAC) from Social Channels
CAC measures how much it costs to acquire a new customer through your social media efforts. It’s calculated by dividing your total social media spending (organic + paid) by the number of new customers acquired through those channels during a specific period.
For example, if you spend $10,000 on social media in a month and acquire 100 new customers, your social media CAC is $100.
Tracking CAC by platform helps identify your most cost-effective acquisition channels. Perhaps LinkedIn drives higher-value B2B customers at a reasonable CAC, while TikTok brings in more customers but at a higher acquisition cost.
Strategies to reduce your social media CAC include:
- Improving targeting precision to reach more qualified prospects
- Creating more compelling content that resonates with your ideal customers
- Optimizing conversion funnels to reduce drop-offs
- Leveraging user-generated content to build trust with prospects
- Implementing referral programs to encourage customer advocacy
The most sophisticated growth companies track CAC trends over time, constantly working to improve this metric while maintaining customer quality.
Customer Lifetime Value to CAC Ratio
The LTV:CAC ratio compares what it costs to acquire a customer from social media to the revenue that customer generates over their lifetime relationship with your business. This ratio provides crucial context for your CAC figures.
For example, if your social media CAC is $100 and the average customer spends $300 over their lifetime, your LTV:CAC ratio is 3:1.
This ratio helps answer the fundamental question: “Is our social media spending creating lasting value?” A healthy LTV:CAC ratio for most businesses is 3:1 or higher, meaning each customer generates at least three times what it cost to acquire them.
| LTV:CAC Ratio | Interpretation | Recommended Action |
|---|---|---|
| Less than 1:1 | Unsustainable – losing money on each customer | Urgently reduce CAC or increase customer value |
| 1:1 to 2:1 | Concerning – minimal profit margin | Improve acquisition efficiency and customer monetization |
| 3:1 to 5:1 | Healthy – good business model | Maintain current approach, test incremental improvements |
| Greater than 5:1 | Excellent – very profitable | Consider scaling acquisition spend to capture more market |
The table above helps interpret different LTV:CAC ratios and suggests appropriate actions based on where your business falls. Top growth companies regularly calculate this ratio for customers acquired through different social channels and adjust their strategy accordingly.
To improve your LTV:CAC ratio, focus on both sides of the equation: reduce acquisition costs through better targeting and content, while increasing lifetime value through improved customer experience, upselling, and retention initiatives.
Content Performance KPIs for Strategic Decision-Making
Content is the fuel that powers social media success. These KPIs help you understand which content types, formats, and topics drive the best results, allowing you to optimize your content strategy for maximum impact.
Content Type Performance Comparison
Different content formats often produce dramatically different results. Understanding which social media post types perform best helps you allocate resources more effectively. The key content marketing KPIs to track include engagement rate, reach, conversion rate, and content lifespan.
Video continues to dominate social media engagement across platforms. Short-form video in particular drives the highest engagement rates, with TikTok, Instagram Reels, and YouTube Shorts leading the charge.
The table above compares different content formats across engagement rates, time investment, and ideal use cases. This information helps you balance the effort required against the potential returns when planning your content mix.
Growth companies track content performance at a granular level, examining how specific topics, themes, and formats resonate with different audience segments. This analysis informs content calendars and resource allocation.
Reach and Impressions Metrics That Matter
Reach measures the number of unique users who see your content, while impressions count the total number of times your content is displayed (including multiple views by the same user). Together, these metrics reveal your content’s visibility and potential audience impact.
While these metrics often get labeled as “vanity metrics,” they provide crucial context for other KPIs. For example, a post with high engagement but low reach may indicate highly relevant content that algorithms aren’t distributing widely. Conversely, high reach with low engagement suggests content that attracts views but fails to resonate deeply.
Growth companies track reach and impressions with these key considerations:
- Reach growth rate over time (not just absolute numbers)
- Reach by content type and topic
- Reach relative to follower count (reach rate)
- Paid vs. organic reach comparison
- Impression-to-engagement ratio
These metrics help you understand not just how many people see your content, but how effectively your content strategy expands your audience over time.
Share of Voice and Brand Sentiment
Share of Voice (SOV) measures your brand’s visibility in social conversations relative to competitors. It answers the question: “When people talk about our industry, how often are they talking about us versus our competitors?”
Calculating SOV involves dividing your brand mentions by total industry mentions and expressing the result as a percentage. For example, if there are 10,000 social mentions about your industry and your brand accounts for 2,000 of them, your SOV is 20%.
Brand sentiment analyzes the emotional tone of those mentions – positive, negative, or neutral. Together with SOV, sentiment provides a comprehensive view of your brand’s social standing.
Growth companies track these metrics using specialized social listening tools that monitor conversations across platforms. They examine:
- SOV trends over time
- Sentiment distribution (% positive, negative, neutral)
- Sentiment drivers (what causes positive or negative reactions)
- Competitor sentiment comparison
- Industry conversation trends
This analysis helps identify reputation risks early and uncover opportunities to join relevant conversations that can increase your brand visibility.
As social media programs mature, sophisticated companies adopt more advanced metrics that connect social activities to long-term business outcomes. These KPIs provide deeper insights into how social media contributes to business growth beyond immediate conversions.
Customer Retention Rate from Social Engagement
This metric examines the relationship between social media engagement and customer retention. It measures whether customers who interact with your brand on social channels stay with you longer than those who don’t.
Calculating this requires connecting your social engagement data with your customer database. You can then compare retention rates between customers who engage on social versus those who don’t, ideally controlling for other factors that might influence retention.
This analysis often reveals that engaged social followers have significantly higher retention rates. Data shows that purchase intent is closely tied to social media engagement, with 26.6% of social media users seeking inspiration to buy and 25.9% actively searching for products on these platforms.
Growth companies use these insights to develop retention-focused social strategies, such as:
- Customer education content that improves product usage
- Exclusive community groups that foster belonging
- User-generated content programs that increase emotional investment
- Proactive social customer service that resolves issues quickly
- Recognition programs that celebrate customer successes
Purchase Intent Signals
Purchase intent signals are behaviors that indicate a user is moving closer to making a purchase decision. On social media, these signals might include:
- Product page visits from social media traffic
- Pricing page views after engaging with social content
- Product-specific questions in comments or DMs
- Engagement with bottom-funnel content like comparisons or reviews
- Multiple return visits from the same social source
Growth companies create scoring systems that weight these signals based on their correlation with actual purchases. This scoring helps identify high-potential prospects for targeted follow-up.
For example, a user who visits your pricing page from Instagram, then returns to view product demos, and finally comments with a specific question about features would receive a high intent score – signaling an opportunity for sales outreach or targeted advertising.
Cross-Platform Attribution
Cross-platform attribution tracks how users interact with your brand across multiple social platforms and touchpoints before converting. This analysis helps you understand the full customer journey and the role each platform plays in driving conversions.
For example, a customer might first discover your brand through a TikTok video, then follow you on Instagram, engage with your content there for several weeks, click through to your website from a LinkedIn post, and finally purchase after receiving a retargeted ad on Facebook.
Simple last-click attribution would credit only Facebook for this conversion, missing the crucial roles TikTok, Instagram, and LinkedIn played in the journey. Multi-touch attribution provides a more accurate picture of each platform’s contribution.
Growth companies implement cross-platform attribution using:
- UTM parameters that track traffic sources
- Customer journey mapping tools
- CRM systems that record touchpoints
- Attribution modeling software
- First-party data collection
This comprehensive view enables more accurate resource allocation across platforms and helps identify the most effective platform combinations for your specific business goals.
Implementing an Effective KPI Tracking System
Having the right KPIs is only valuable if you have systems to track, analyze, and act on them effectively. A comprehensive social media strategy requires thoughtful implementation of measurement processes.
Start with these implementation steps:
- Align KPIs with business objectives – Ensure each metric connects to a specific business goal
- Set up proper tracking tools – Implement analytics platforms, UTM parameters, and conversion tracking
- Establish measurement frequency – Determine how often to analyze each KPI (daily, weekly, monthly)
- Create dashboards for visualization – Build easy-to-understand reports for stakeholders
- Develop action protocols – Define how you’ll respond to different KPI results
The right tools make tracking these KPIs much easier. Here’s a comparison of popular social media analytics platforms:
| Tool | Best For | Key Features | Price Range |
|---|---|---|---|
| Sprout Social | Mid-to-large businesses | Comprehensive reporting, competitive analysis, content performance | $99-$249/month |
| Hootsuite | Multi-platform management | Post scheduling, basic analytics, team collaboration | $49-$739/month |
| Buffer | Small businesses | User-friendly interface, content scheduling, engagement tracking | $15-$99/month |
| Brandwatch | Enterprise social listening | Advanced sentiment analysis, share of voice, trend identification | Custom pricing |
The most important aspect of KPI implementation is turning data into action. Growth companies establish regular review processes that examine KPI trends, identify opportunities for improvement, and adjust strategy accordingly.


The social media KPIs that top growth companies track go far beyond surface-level metrics. They focus on measurements that connect directly to business outcomes – engagement that drives action, revenue-focused metrics that demonstrate financial impact, content performance indicators that inform resource allocation, and advanced KPIs that reveal deeper business value.
In my work with growing companies, I’ve consistently seen that those who implement rigorous measurement processes outperform those who take a more casual approach to social media metrics. The difference lies not just in what they measure, but in how systematically they use those insights to refine their strategy.
Start by implementing the core KPIs discussed in this article, then gradually expand to more sophisticated measurements as your social media program matures. Remember that the goal isn’t just to collect data, but to generate actionable insights that drive growth.
With the right KPIs in place, your social media strategy becomes not just another marketing activity, but a predictable driver of business growth with clear, measurable ROI.
Actionable advice for your digital / content / influencer / social media marketing.
Join 13,000+ smart professionals who subscribe to my regular updates.

